| Param | Original file | Final file |
|---|---|---|
| Filename | modeM0/AS1A03_033T01_9000001368cztM0_level2.evt | modeM0/AS1A03_033T01_9000001368cztM0_level2_quad_clean.evt |
| Size (bytes) | 1,809,786,240 | 346,901,760 |
| Size | 1.7 GB | 330.8 MB |
| Events in quadrant A | 12,375,382 | 2,246,652 |
| Events in quadrant B | 12,131,595 | 2,249,991 |
| Events in quadrant C | 11,445,867 | 2,189,972 |
| Events in quadrant D | 17,196,747 | 2,130,101 |
| Mode M0 | |||
|---|---|---|---|
| Quadrant | BADHDUFLAG | Total packets | Discarded packets |
| A | 0 | 52620 | 0 |
| B | 0 | 51698 | 0 |
| C | 0 | 50830 | 0 |
| D | 0 | 67717 | 0 |
| Mode SS | |||
|---|---|---|---|
| Quadrant | BADHDUFLAG | Total packets | Discarded packets |
| A | 0 | 498 | 0 |
| B | 0 | 502 | 0 |
| C | 0 | 502 | 0 |
| D | 0 | 500 | 0 |
| Mode M9 | |||
|---|---|---|---|
| Quadrant | BADHDUFLAG | Total packets | Discarded packets |
| A | 0 | 51 | 0 |
| B | 0 | 49 | 0 |
| C | 0 | 51 | 0 |
| D | 0 | 51 | 0 |
| Quadrant | Total seconds | Saturated seconds | Saturation percentage |
|---|---|---|---|
| A | 24588 | 679 | 2.761510% |
| B | 24571 | 518 | 2.108176% |
| C | 24578 | 398 | 1.619334% |
| D | 24513 | 1585 | 6.465957% |
Noise dominated data is calculated using 1-second bins in cleaned event files. If a bin has >2000 counts, and if more than 50% of those come from <1% of pixels, then it is considered to be noise-dominated and hence unusable.
| Quadrant | # 1 sec bins | Bins with >0 counts | Bins with >2000 counts | High rate bins dominated by noise | Noise dominated (total time) | Noise dominated (detector-on time) | Marked lightcurve |
|---|---|---|---|---|---|---|---|
| A | 29153 | 24867 | 131 | 131 | 0.45% | 0.53% |  |
| B | 29153 | 24867 | 4 | 4 | 0.01% | 0.02% |  |
| C | 29153 | 24864 | 12 | 12 | 0.04% | 0.05% |  |
| D | 29153 | 24832 | 1102 | 1102 | 3.78% | 4.44% |  |
Top three noisy pixels from each quadrant. If the there are fewer than three noisy pixels in the level2.evt file, extra rows are filled as -1
| Pixel properties | Quadrant properties | ||||||
|---|---|---|---|---|---|---|---|
| Quadrant | DetID | PixID | Counts | Sigma | Mean | Median | Sigma |
| A | 14 | 111 | 621631 | 1043.13 | 2985 | 2932 | 593.1 |
| A | 1 | 162 | 101039 | 165.41 | 2985 | 2932 | 593.1 |
| A | 3 | 1 | 55609 | 88.81 | 2985 | 2932 | 593.1 |
| B | 0 | 214 | 233829 | 414.28 | 2994 | 2928 | 557.4 |
| B | 0 | 229 | 124112 | 217.43 | 2994 | 2928 | 557.4 |
| B | 12 | 111 | 58476 | 99.66 | 2994 | 2928 | 557.4 |
| C | 4 | 254 | 172199 | 257.8 | 2882 | 2891 | 656.7 |
| C | 13 | 61 | 21828 | 28.84 | 2882 | 2891 | 656.7 |
| C | 9 | 237 | 19625 | 25.48 | 2882 | 2891 | 656.7 |
| D | 1 | 52 | 3882850 | 5608.8 | 2815 | 2748 | 691.8 |
| D | 8 | 195 | 1396723 | 2015.03 | 2815 | 2748 | 691.8 |
| D | 7 | 71 | 243188 | 347.56 | 2815 | 2748 | 691.8 |
Histogram calculated using DETX and DETY for each event in the final _common_clean file
| Quadrant A |  |
 |
Quadrant B |
|---|---|---|---|
| Quadrant D |  |
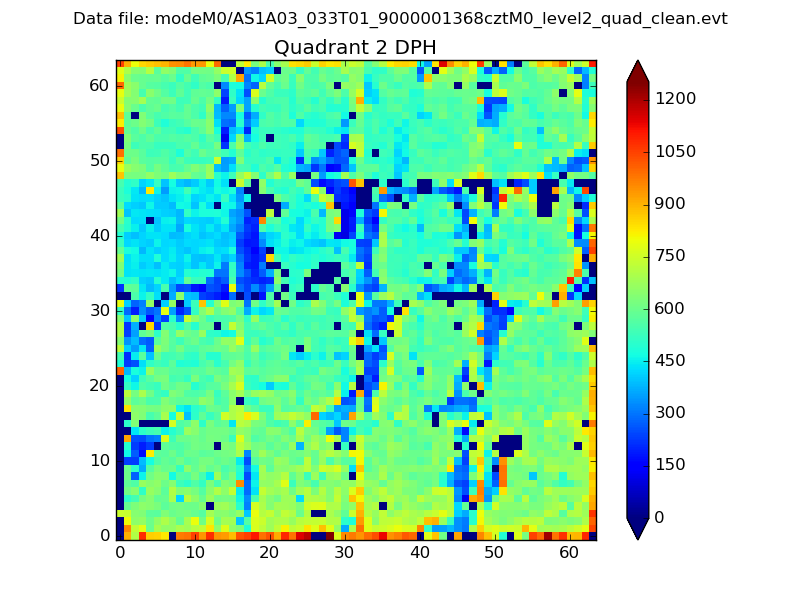 |
Quadrant C |
| Plot type | Count rate plots | Images |
|---|---|---|
| Comparison with Poisson distribution Blue bars denote a histogram of data divided into 1 sec bins. Red curve is a Poisson curve with rate = median count rate of data. |
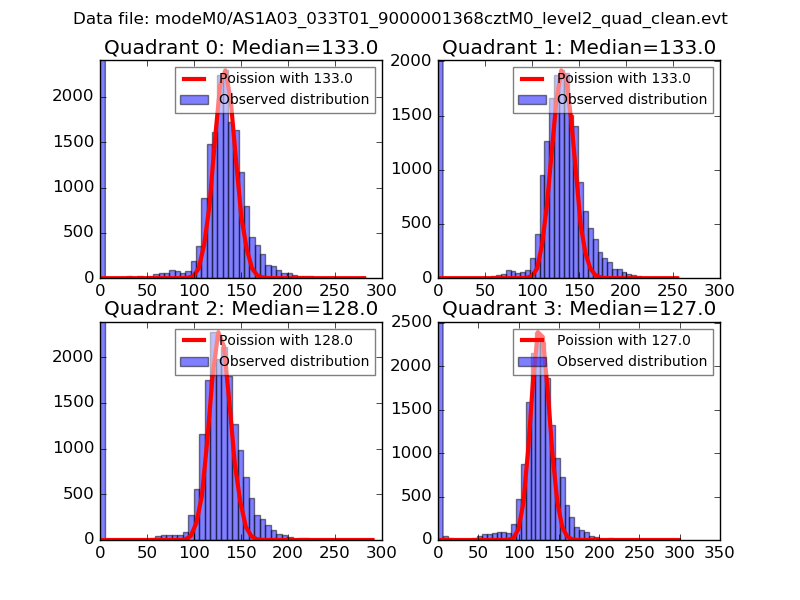 |
 |
| Quadrant-wise count rates Data is divided into 100 sec bins |
 |
|
| Module-wise count rates for Quadrant A Data is divided into 100 sec bins |
 |
 |
| Module-wise count rates for Quadrant B Data is divided into 100 sec bins |
 |
 |
| Module-wise count rates for Quadrant C Data is divided into 100 sec bins |
 |
 |
| Module-wise count rates for Quadrant D Data is divided into 100 sec bins |
 |
 |
| Parameter | Plot |
|---|---|
| CZT HV Monitor |  |
| D_VDD |  |
| Temperature 1 |  |
| Veto HV Monitor | 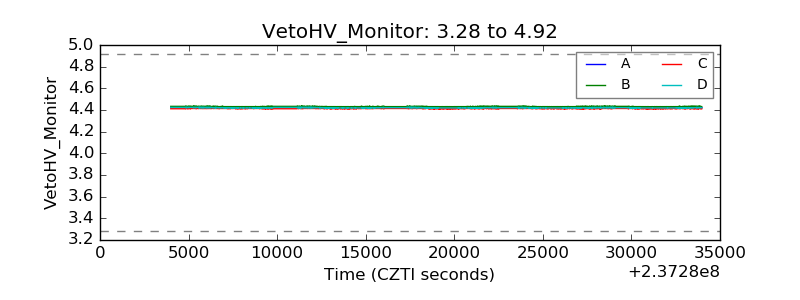 |
| Veto LLD | 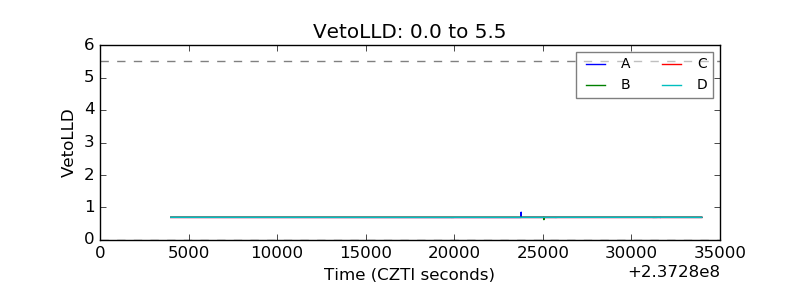 |
| Alpha Counter |  |
| _CPM_Rate |  |
| CZT Counter |  |
| +2.5 Volts monitor |  |
| +5 Volts monitor |  |
| _ROLL_ROT |  |
| _Roll_DEC |  |
| _Roll_RA |  |
| Veto Counter |  |