| Param | Original file | Final file |
|---|---|---|
| Filename | modeM0/AS1G07_052T01_9000001362cztM0_level2.evt | modeM0/AS1G07_052T01_9000001362cztM0_level2_quad_clean.evt |
| Size (bytes) | 1,185,413,760 | 217,198,080 |
| Size | 1.1 GB | 207.1 MB |
| Events in quadrant A | 8,615,861 | 1,403,961 |
| Events in quadrant B | 7,341,209 | 1,430,460 |
| Events in quadrant C | 7,105,278 | 1,388,865 |
| Events in quadrant D | 11,818,541 | 1,314,040 |
| Mode M0 | |||
|---|---|---|---|
| Quadrant | BADHDUFLAG | Total packets | Discarded packets |
| A | 0 | 35675 | 0 |
| B | 0 | 31491 | 0 |
| C | 0 | 31149 | 0 |
| D | 0 | 45217 | 0 |
| Mode SS | |||
|---|---|---|---|
| Quadrant | BADHDUFLAG | Total packets | Discarded packets |
| A | 0 | 306 | 0 |
| B | 0 | 306 | 0 |
| C | 0 | 306 | 0 |
| D | 0 | 306 | 0 |
| Mode M9 | |||
|---|---|---|---|
| Quadrant | BADHDUFLAG | Total packets | Discarded packets |
| A | 0 | 28 | 0 |
| B | 0 | 28 | 0 |
| C | 0 | 28 | 0 |
| D | 0 | 28 | 0 |
| Quadrant | Total seconds | Saturated seconds | Saturation percentage |
|---|---|---|---|
| A | 15092 | 413 | 2.736549% |
| B | 15099 | 262 | 1.735214% |
| C | 15100 | 188 | 1.245033% |
| D | 15072 | 1513 | 10.038482% |
Noise dominated data is calculated using 1-second bins in cleaned event files. If a bin has >2000 counts, and if more than 50% of those come from <1% of pixels, then it is considered to be noise-dominated and hence unusable.
| Quadrant | # 1 sec bins | Bins with >0 counts | Bins with >2000 counts | High rate bins dominated by noise | Noise dominated (total time) | Noise dominated (detector-on time) | Marked lightcurve |
|---|---|---|---|---|---|---|---|
| A | 17824 | 15110 | 4 | 4 | 0.02% | 0.03% | 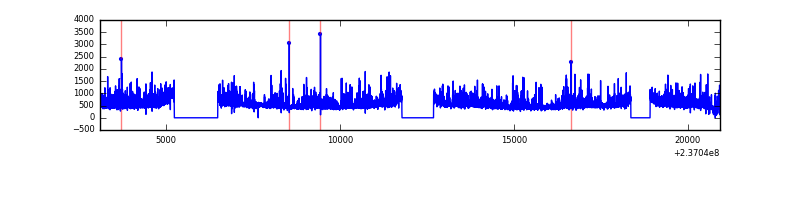 |
| B | 17825 | 15113 | 4 | 4 | 0.02% | 0.03% | 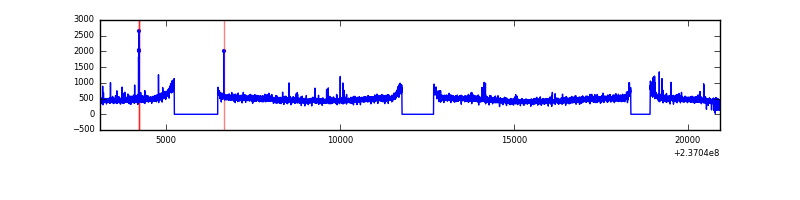 |
| C | 17825 | 15112 | 0 | 0 | 0.00% | 0.00% |  |
| D | 17824 | 15109 | 1008 | 1008 | 5.66% | 6.67% |  |
Top three noisy pixels from each quadrant. If the there are fewer than three noisy pixels in the level2.evt file, extra rows are filled as -1
| Pixel properties | Quadrant properties | ||||||
|---|---|---|---|---|---|---|---|
| Quadrant | DetID | PixID | Counts | Sigma | Mean | Median | Sigma |
| A | 1 | 162 | 580597 | 1548.04 | 1855 | 1821 | 373.9 |
| A | 1 | 178 | 313347 | 833.23 | 1855 | 1821 | 373.9 |
| A | 1 | 161 | 290751 | 772.79 | 1855 | 1821 | 373.9 |
| B | 10 | 245 | 63250 | 172.75 | 1861 | 1819 | 355.6 |
| B | 12 | 111 | 41839 | 112.54 | 1861 | 1819 | 355.6 |
| B | 11 | 111 | 34184 | 91.01 | 1861 | 1819 | 355.6 |
| C | 13 | 61 | 13201 | 26.95 | 1819 | 1827 | 422.0 |
| C | 9 | 68 | 8090 | 14.84 | 1819 | 1827 | 422.0 |
| C | 12 | 4 | 6553 | 11.2 | 1819 | 1827 | 422.0 |
| D | 1 | 52 | 4875369 | 10753.46 | 1756 | 1725 | 453.2 |
| D | 5 | 113 | 75119 | 161.94 | 1756 | 1725 | 453.2 |
| D | 2 | 234 | 71239 | 153.38 | 1756 | 1725 | 453.2 |
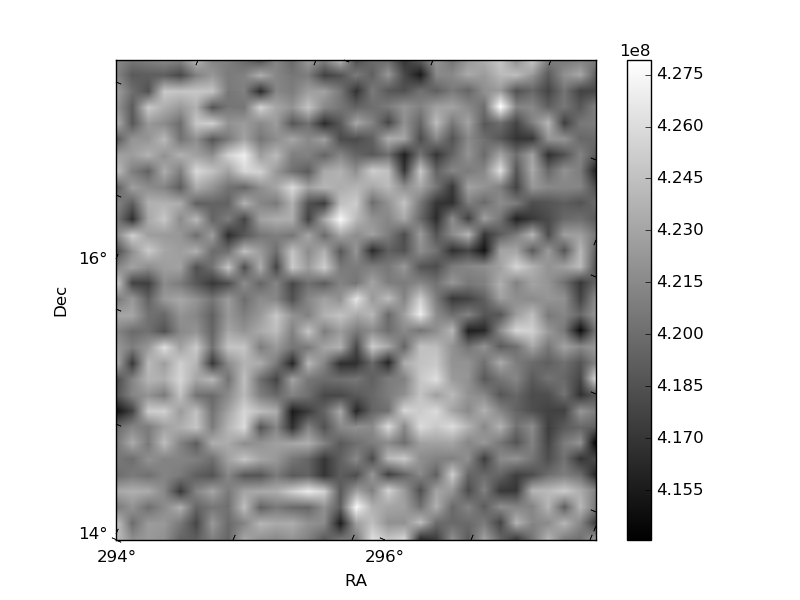
Histogram calculated using DETX and DETY for each event in the final _common_clean file
| Quadrant A |  |
 |
Quadrant B |
|---|---|---|---|
| Quadrant D |  |
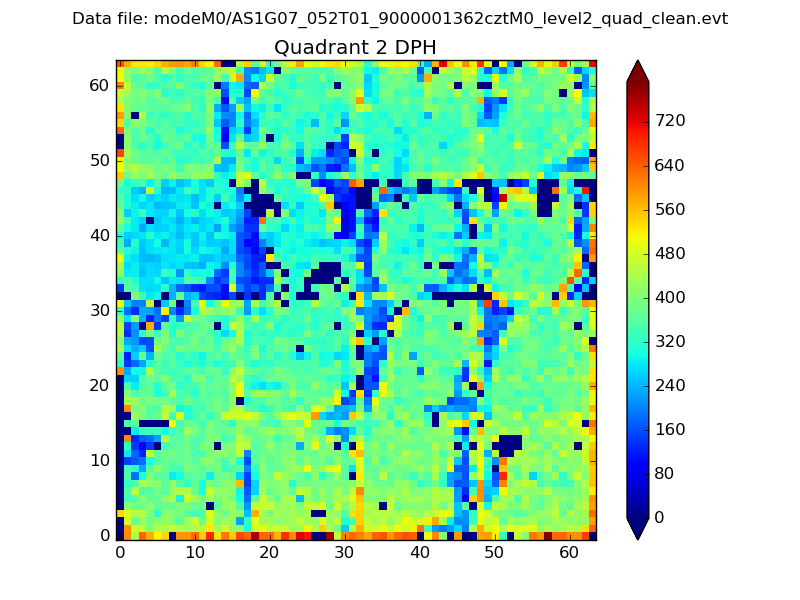 |
Quadrant C |
| Plot type | Count rate plots | Images |
|---|---|---|
| Comparison with Poisson distribution Blue bars denote a histogram of data divided into 1 sec bins. Red curve is a Poisson curve with rate = median count rate of data. |
 |
 |
| Quadrant-wise count rates Data is divided into 100 sec bins |
 |
|
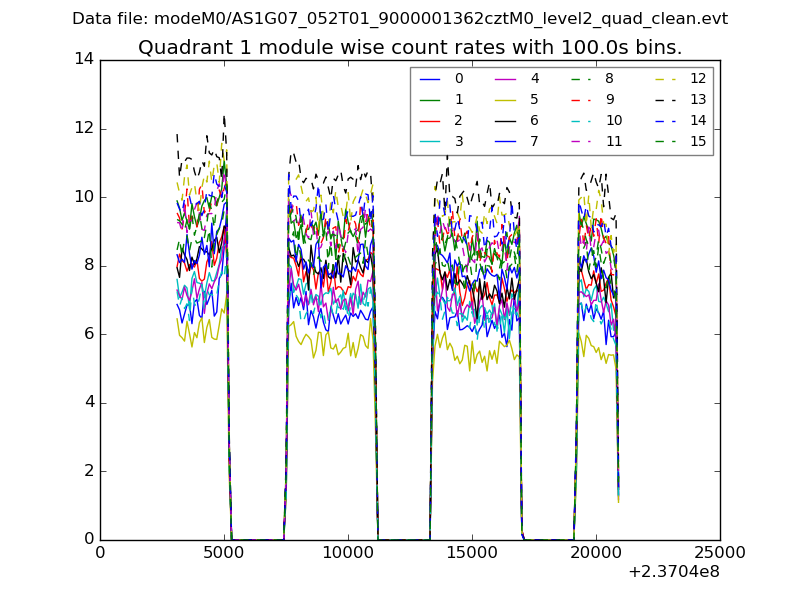
| Module-wise count rates for Quadrant A Data is divided into 100 sec bins |
 |
 |
| Module-wise count rates for Quadrant B Data is divided into 100 sec bins |
 |
 |
| Module-wise count rates for Quadrant C Data is divided into 100 sec bins |
 |
 |
| Module-wise count rates for Quadrant D Data is divided into 100 sec bins |
 |
 |
| Parameter | Plot |
|---|---|
| CZT HV Monitor |  |
| D_VDD |  |
| Temperature 1 |  |
| Veto HV Monitor |  |
| Veto LLD |  |
| Alpha Counter |  |
| _CPM_Rate |  |
| CZT Counter |  |
| +2.5 Volts monitor |  |
| +5 Volts monitor |  |
| _ROLL_ROT | 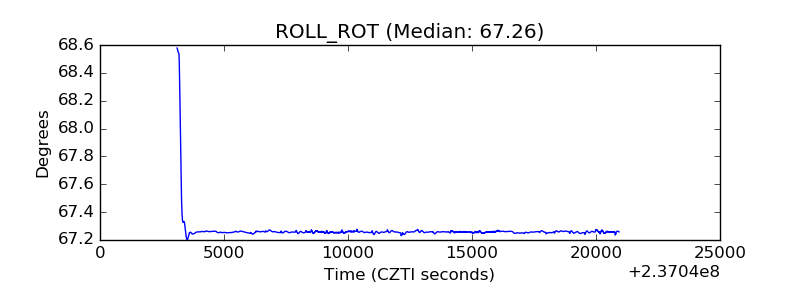 |
| _Roll_DEC |  |
| _Roll_RA | 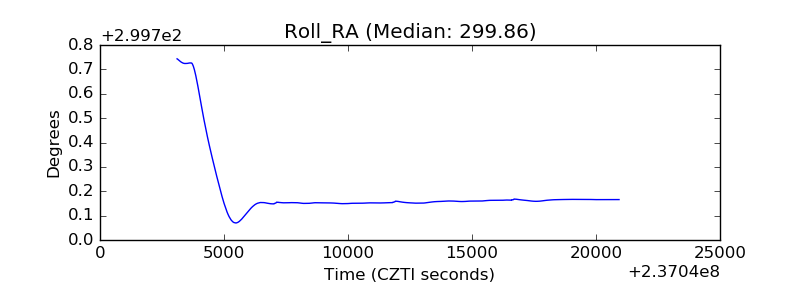 |
| Veto Counter |  |