| Param | Original file | Final file |
|---|---|---|
| Filename | modeM0/AS1G05_238T01_9000001364cztM0_level2_bc.evt | modeM0/AS1G05_238T01_9000001364cztM0_level2_quad_clean.evt |
| Size (bytes) | 4,327,989,120 | 1,474,983,360 |
| Size | 4.0 GB | 1.4 GB |
| Events in quadrant A | 26,538,264 | 9,303,518 |
| Events in quadrant B | 26,298,429 | 9,306,524 |
| Events in quadrant C | 25,256,785 | 9,017,711 |
| Events in quadrant D | 44,628,997 | 8,653,342 |
| Mode M0 | |||
|---|---|---|---|
| Quadrant | BADHDUFLAG | Total packets | Discarded packets |
| A | 0 | 272091 | 0 |
| B | 0 | 258755 | 0 |
| C | 0 | 254823 | 0 |
| D | 0 | 319242 | 0 |
| Mode SS | |||
|---|---|---|---|
| Quadrant | BADHDUFLAG | Total packets | Discarded packets |
| A | 0 | 2510 | 0 |
| B | 0 | 2525 | 0 |
| C | 0 | 2503 | 0 |
| D | 0 | 2500 | 0 |
| Mode M9 | |||
|---|---|---|---|
| Quadrant | BADHDUFLAG | Total packets | Discarded packets |
| A | 0 | 205 | 0 |
| B | 0 | 204 | 0 |
| C | 0 | 205 | 0 |
| D | 0 | 206 | 0 |
| Quadrant | Total seconds | Saturated seconds | Saturation percentage |
|---|---|---|---|
| A | 122372 | 2028 | 1.657242% |
| B | 122622 | 1744 | 1.422257% |
| C | 122707 | 1220 | 0.994238% |
| D | 121790 | 6478 | 5.318992% |
Noise dominated data is calculated using 1-second bins in cleaned event files. If a bin has >2000 counts, and if more than 50% of those come from <1% of pixels, then it is considered to be noise-dominated and hence unusable.
| Quadrant | # 1 sec bins | Bins with >0 counts | Bins with >2000 counts | High rate bins dominated by noise | Noise dominated (total time) | Noise dominated (detector-on time) | Marked lightcurve |
|---|---|---|---|---|---|---|---|
| A | 180134 | 127241 | 0 | 0 | 0.00% | 0.00% |  |
| B | 180130 | 127482 | 2 | 2 | 0.00% | 0.00% |  |
| C | 180129 | 127528 | 68 | 68 | 0.04% | 0.05% |  |
| D | 180136 | 126844 | 1110 | 1110 | 0.62% | 0.88% |  |
Top three noisy pixels from each quadrant. If the there are fewer than three noisy pixels in the level2.evt file, extra rows are filled as -1
| Pixel properties | Quadrant properties | ||||||
|---|---|---|---|---|---|---|---|
| Quadrant | DetID | PixID | Counts | Sigma | Mean | Median | Sigma |
| A | 1 | 162 | 1210755 | 866.95 | 6419 | 6292 | 1389.3 |
| A | 13 | 14 | 236702 | 165.84 | 6419 | 6292 | 1389.3 |
| A | 1 | 161 | 154496 | 106.67 | 6419 | 6292 | 1389.3 |
| B | 0 | 214 | 537513 | 447.01 | 6407 | 6232 | 1188.5 |
| B | 4 | 80 | 373207 | 308.77 | 6407 | 6232 | 1188.5 |
| B | 0 | 219 | 195272 | 159.06 | 6407 | 6232 | 1188.5 |
| C | 9 | 68 | 978122 | 732.87 | 6159 | 6079 | 1326.3 |
| C | 14 | 234 | 112440 | 80.19 | 6159 | 6079 | 1326.3 |
| C | 13 | 61 | 37609 | 23.77 | 6159 | 6079 | 1326.3 |
| D | 1 | 52 | 13183367 | 8920.55 | 6074 | 5887 | 1477.2 |
| D | 8 | 195 | 2591693 | 1750.47 | 6074 | 5887 | 1477.2 |
| D | 13 | 122 | 2319605 | 1566.28 | 6074 | 5887 | 1477.2 |
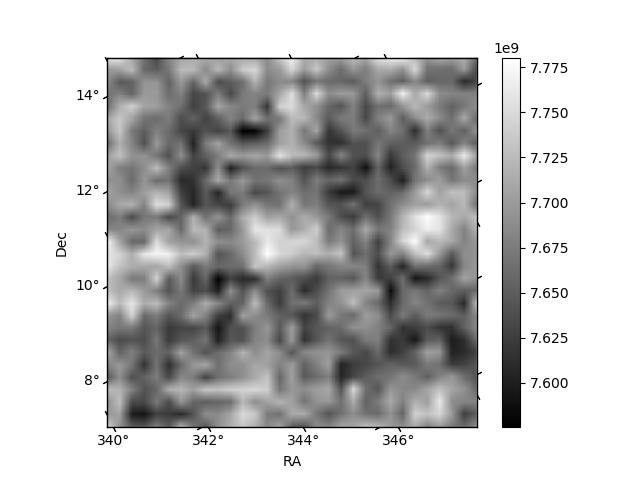
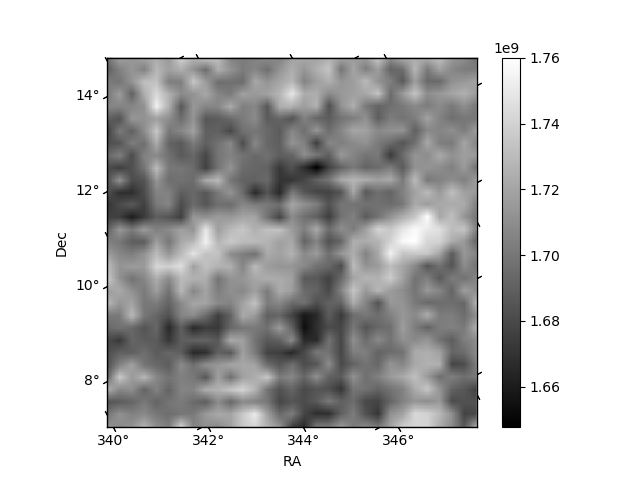
Histogram calculated using DETX and DETY for each event in the final _common_clean file
| Quadrant A |  |
 |
Quadrant B |
|---|---|---|---|
| Quadrant D |  |
 |
Quadrant C |
| Plot type | Count rate plots | Images |
|---|---|---|
| Comparison with Poisson distribution Blue bars denote a histogram of data divided into 1 sec bins. Red curve is a Poisson curve with rate = median count rate of data. |
 |
 |
| Quadrant-wise count rates Data is divided into 100 sec bins |
 |
|
| Module-wise count rates for Quadrant A Data is divided into 100 sec bins |
 |
 |
| Module-wise count rates for Quadrant B Data is divided into 100 sec bins |
 |
 |
| Module-wise count rates for Quadrant C Data is divided into 100 sec bins |
 |
 |
| Module-wise count rates for Quadrant D Data is divided into 100 sec bins |
 |
 |
| Parameter | Plot |
|---|---|
| CZT HV Monitor |  |
| D_VDD | 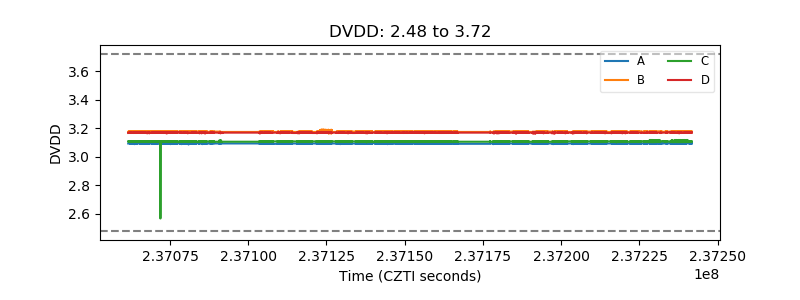 |
| Temperature 1 |  |
| Veto HV Monitor |  |
| Veto LLD |  |
| Alpha Counter |  |
| _CPM_Rate |  |
| CZT Counter | 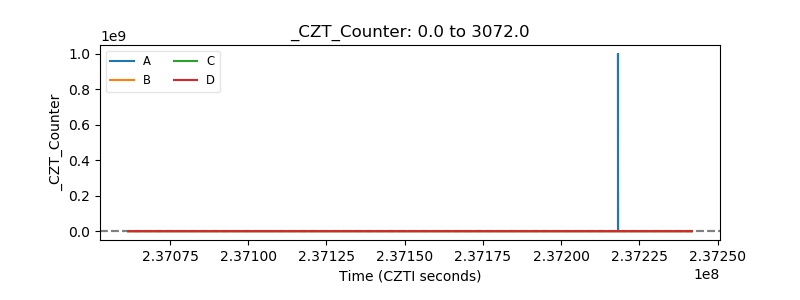 |
| +2.5 Volts monitor |  |
| +5 Volts monitor |  |
| _ROLL_ROT |  |
| _Roll_DEC |  |
| _Roll_RA | 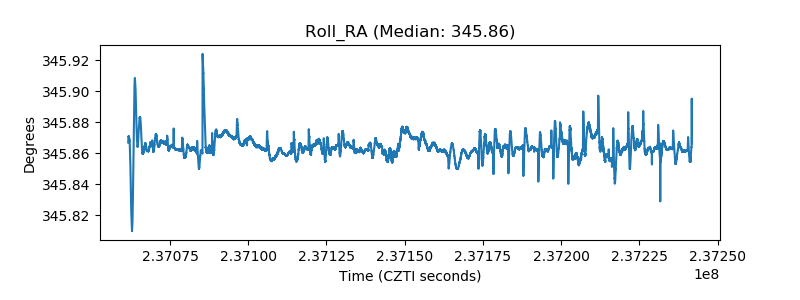 |
| Veto Counter |  |