| Param | Original file | Final file |
|---|---|---|
| Filename | modeM0/AS1G07_042T01_9000001360cztM0_level2.evt | modeM0/AS1G07_042T01_9000001360cztM0_level2_quad_clean.evt |
| Size (bytes) | 4,539,991,680 | 837,547,200 |
| Size | 4.2 GB | 798.7 MB |
| Events in quadrant A | 35,875,627 | 5,350,867 |
| Events in quadrant B | 30,919,513 | 5,393,624 |
| Events in quadrant C | 29,438,936 | 5,297,783 |
| Events in quadrant D | 37,055,535 | 5,051,275 |
| Mode M0 | |||
|---|---|---|---|
| Quadrant | BADHDUFLAG | Total packets | Discarded packets |
| A | 0 | 147681 | 0 |
| B | 0 | 131405 | 0 |
| C | 0 | 128503 | 0 |
| D | 0 | 151310 | 0 |
| Mode M9 | |||
|---|---|---|---|
| Quadrant | BADHDUFLAG | Total packets | Discarded packets |
| A | 0 | 97 | 0 |
| B | 0 | 97 | 0 |
| C | 0 | 97 | 0 |
| D | 0 | 97 | 0 |
| Mode SS | |||
|---|---|---|---|
| Quadrant | BADHDUFLAG | Total packets | Discarded packets |
| A | 0 | 1280 | 0 |
| B | 0 | 1276 | 0 |
| C | 0 | 1278 | 0 |
| D | 0 | 1284 | 0 |
| Quadrant | Total seconds | Saturated seconds | Saturation percentage |
|---|---|---|---|
| A | 62268 | 1315 | 2.111839% |
| B | 62325 | 883 | 1.416767% |
| C | 62307 | 529 | 0.849022% |
| D | 62298 | 2315 | 3.716010% |
Noise dominated data is calculated using 1-second bins in cleaned event files. If a bin has >2000 counts, and if more than 50% of those come from <1% of pixels, then it is considered to be noise-dominated and hence unusable.
| Quadrant | # 1 sec bins | Bins with >0 counts | Bins with >2000 counts | High rate bins dominated by noise | Noise dominated (total time) | Noise dominated (detector-on time) | Marked lightcurve |
|---|---|---|---|---|---|---|---|
| A | 73709 | 63099 | 29 | 29 | 0.04% | 0.05% | 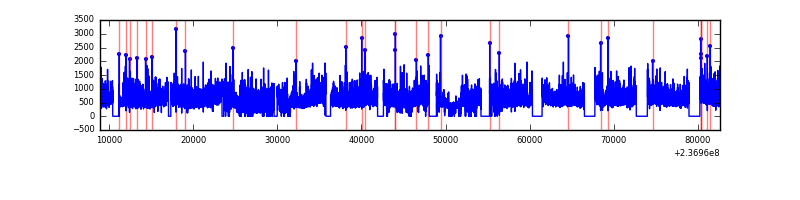 |
| B | 73709 | 63171 | 55 | 55 | 0.07% | 0.09% |  |
| C | 73709 | 63133 | 11 | 11 | 0.01% | 0.02% |  |
| D | 73709 | 63142 | 1554 | 1554 | 2.11% | 2.46% |  |
Top three noisy pixels from each quadrant. If the there are fewer than three noisy pixels in the level2.evt file, extra rows are filled as -1
| Pixel properties | Quadrant properties | ||||||
|---|---|---|---|---|---|---|---|
| Quadrant | DetID | PixID | Counts | Sigma | Mean | Median | Sigma |
| A | 1 | 162 | 2342455 | 1512.59 | 7747 | 7624 | 1543.6 |
| A | 1 | 178 | 1228905 | 791.19 | 7747 | 7624 | 1543.6 |
| A | 1 | 161 | 1156093 | 744.02 | 7747 | 7624 | 1543.6 |
| B | 10 | 245 | 242147 | 160.71 | 7755 | 7576 | 1459.6 |
| B | 4 | 80 | 231977 | 153.74 | 7755 | 7576 | 1459.6 |
| B | 12 | 111 | 165436 | 108.15 | 7755 | 7576 | 1459.6 |
| C | 13 | 61 | 55893 | 28.14 | 7512 | 7580 | 1716.7 |
| C | 9 | 68 | 52602 | 26.23 | 7512 | 7580 | 1716.7 |
| C | 14 | 234 | 50846 | 25.2 | 7512 | 7580 | 1716.7 |
| D | 1 | 52 | 6141448 | 3306.37 | 7396 | 7234 | 1855.3 |
| D | 12 | 233 | 858382 | 458.77 | 7396 | 7234 | 1855.3 |
| D | 2 | 234 | 388474 | 205.49 | 7396 | 7234 | 1855.3 |
Histogram calculated using DETX and DETY for each event in the final _common_clean file
| Quadrant A |  |
 |
Quadrant B |
|---|---|---|---|
| Quadrant D |  |
 |
Quadrant C |
| Plot type | Count rate plots | Images |
|---|---|---|
| Comparison with Poisson distribution Blue bars denote a histogram of data divided into 1 sec bins. Red curve is a Poisson curve with rate = median count rate of data. |
 |
 |
| Quadrant-wise count rates Data is divided into 100 sec bins |
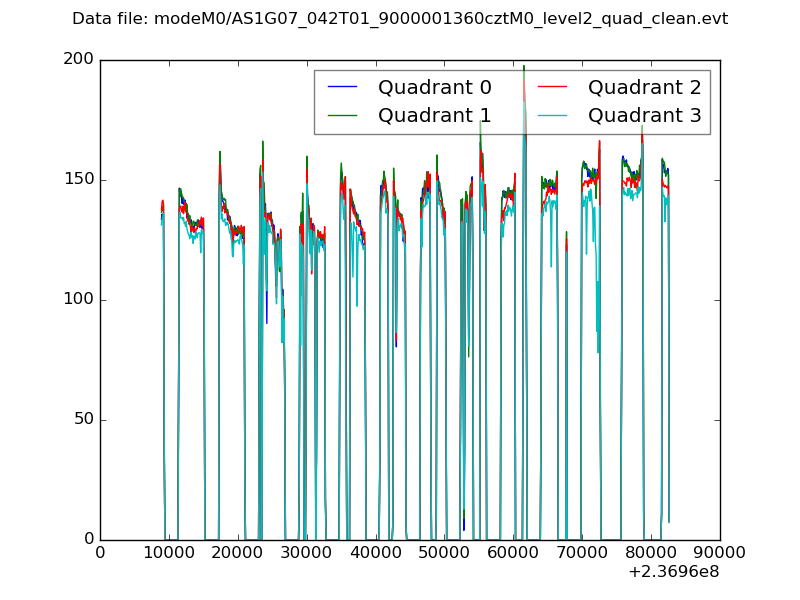 |
|
| Module-wise count rates for Quadrant A Data is divided into 100 sec bins |
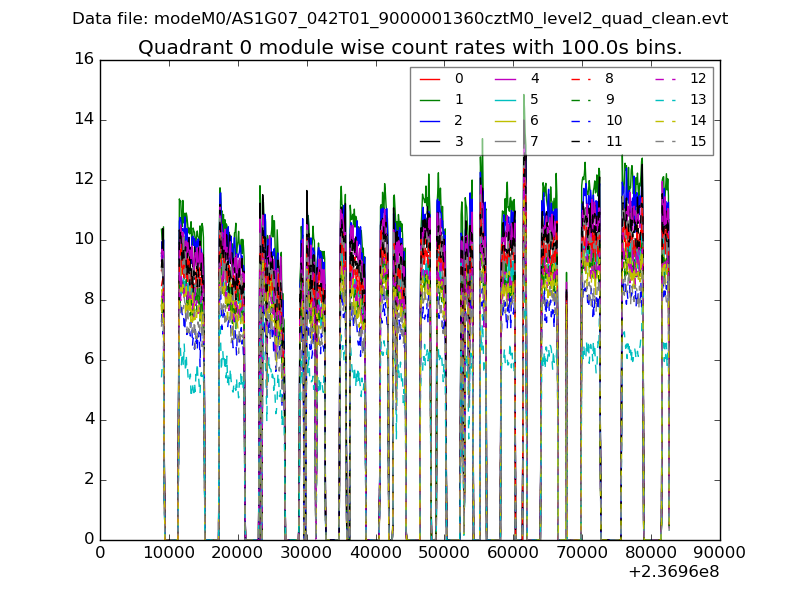 |
 |
| Module-wise count rates for Quadrant B Data is divided into 100 sec bins |
 |
 |
| Module-wise count rates for Quadrant C Data is divided into 100 sec bins |
 |
 |
| Module-wise count rates for Quadrant D Data is divided into 100 sec bins |
 |
 |
| Parameter | Plot |
|---|---|
| CZT HV Monitor |  |
| D_VDD | 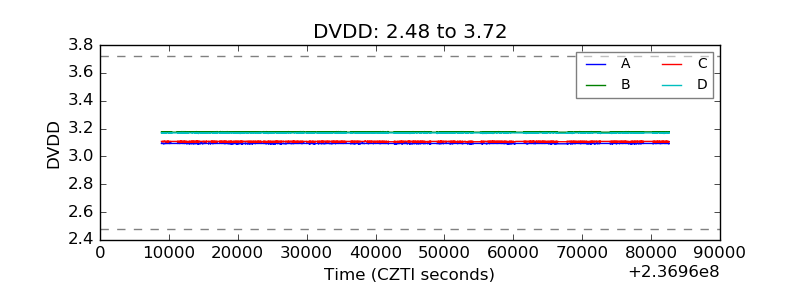 |
| Temperature 1 | 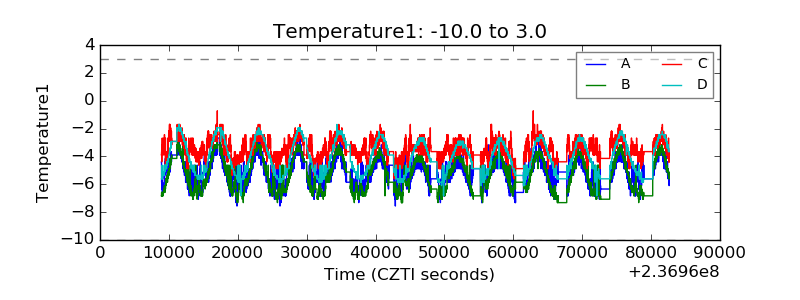 |
| Veto HV Monitor |  |
| Veto LLD | 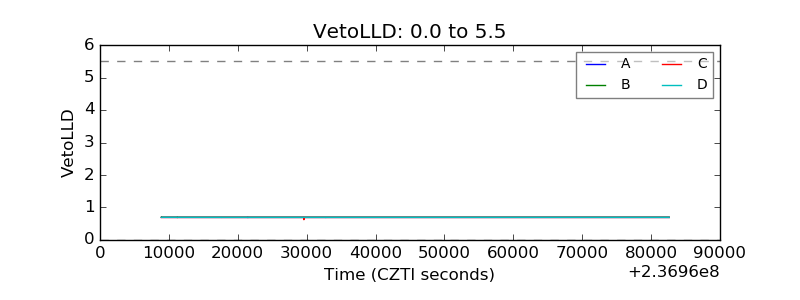 |
| Alpha Counter | 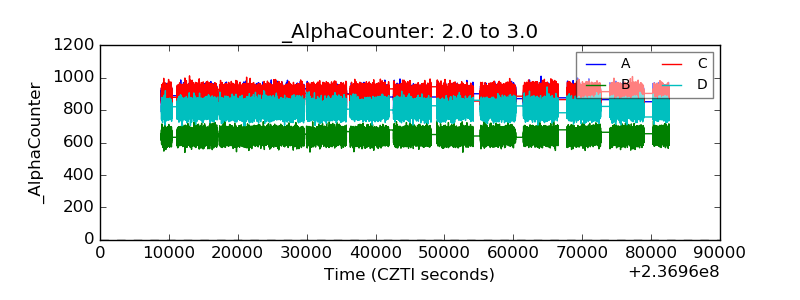 |
| _CPM_Rate |  |
| CZT Counter | 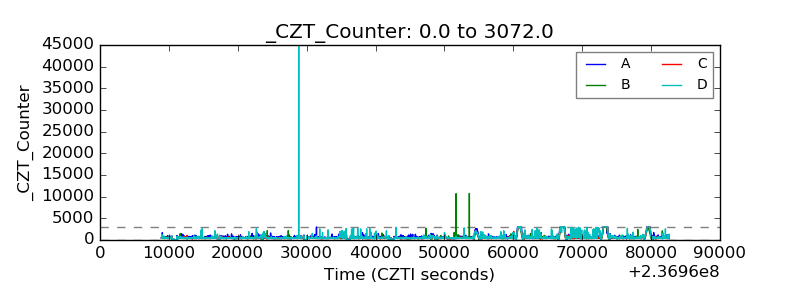 |
| +2.5 Volts monitor |  |
| +5 Volts monitor | 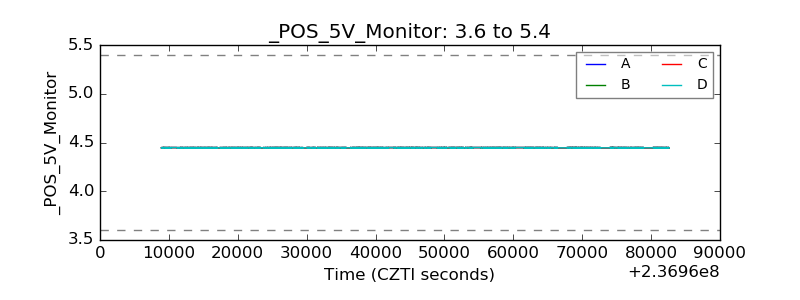 |
| _ROLL_ROT |  |
| _Roll_DEC |  |
| _Roll_RA |  |
| Veto Counter |  |