| Param | Original file | Final file |
|---|---|---|
| Filename | modeM0/AS1G07_049T02_9000001354cztM0_level2.evt | modeM0/AS1G07_049T02_9000001354cztM0_level2_quad_clean.evt |
| Size (bytes) | 2,000,390,400 | 593,640,000 |
| Size | 1.9 GB | 566.1 MB |
| Events in quadrant A | 14,173,616 | 3,800,404 |
| Events in quadrant B | 14,887,443 | 4,694,016 |
| Events in quadrant C | 13,275,152 | 3,790,177 |
| Events in quadrant D | 16,243,892 | 3,662,009 |
| Mode M0 | |||
|---|---|---|---|
| Quadrant | BADHDUFLAG | Total packets | Discarded packets |
| A | 0 | 61836 | 0 |
| B | 0 | 63763 | 0 |
| C | 0 | 60610 | 0 |
| D | 0 | 68479 | 0 |
| Mode M9 | |||
|---|---|---|---|
| Quadrant | BADHDUFLAG | Total packets | Discarded packets |
| A | 0 | 54 | 0 |
| B | 0 | 53 | 0 |
| C | 0 | 53 | 0 |
| D | 0 | 54 | 0 |
| Mode SS | |||
|---|---|---|---|
| Quadrant | BADHDUFLAG | Total packets | Discarded packets |
| A | 0 | 596 | 0 |
| B | 0 | 600 | 0 |
| C | 0 | 600 | 0 |
| D | 0 | 602 | 0 |
| Quadrant | Total seconds | Saturated seconds | Saturation percentage |
|---|---|---|---|
| A | 29632 | 229 | 0.772813% |
| B | 29632 | 327 | 1.103537% |
| C | 29638 | 197 | 0.664687% |
| D | 29651 | 448 | 1.510910% |
Noise dominated data is calculated using 1-second bins in cleaned event files. If a bin has >2000 counts, and if more than 50% of those come from <1% of pixels, then it is considered to be noise-dominated and hence unusable.
| Quadrant | # 1 sec bins | Bins with >0 counts | Bins with >2000 counts | High rate bins dominated by noise | Noise dominated (total time) | Noise dominated (detector-on time) | Marked lightcurve |
|---|---|---|---|---|---|---|---|
| A | 34877 | 29761 | 0 | 0 | 0.00% | 0.00% |  |
| B | 34877 | 29767 | 40 | 40 | 0.11% | 0.13% |  |
| C | 34877 | 29768 | 4 | 4 | 0.01% | 0.01% |  |
| D | 34877 | 29771 | 176 | 176 | 0.50% | 0.59% |  |
Top three noisy pixels from each quadrant. If the there are fewer than three noisy pixels in the level2.evt file, extra rows are filled as -1
| Pixel properties | Quadrant properties | ||||||
|---|---|---|---|---|---|---|---|
| Quadrant | DetID | PixID | Counts | Sigma | Mean | Median | Sigma |
| A | 1 | 162 | 365665 | 518.06 | 3500 | 3428 | 699.2 |
| A | 1 | 178 | 127714 | 177.75 | 3500 | 3428 | 699.2 |
| A | 1 | 161 | 122387 | 170.13 | 3500 | 3428 | 699.2 |
| B | 4 | 80 | 434407 | 672.57 | 3490 | 3406 | 640.8 |
| B | 0 | 214 | 294846 | 454.79 | 3490 | 3406 | 640.8 |
| B | 15 | 85 | 162366 | 248.05 | 3490 | 3406 | 640.8 |
| C | 14 | 234 | 32911 | 38.29 | 3393 | 3403 | 770.6 |
| C | 13 | 61 | 25509 | 28.69 | 3393 | 3403 | 770.6 |
| C | 8 | 222 | 8798 | 7.0 | 3393 | 3403 | 770.6 |
| D | 12 | 227 | 1598017 | 1908.07 | 3369 | 3285 | 835.8 |
| D | 1 | 52 | 797348 | 950.09 | 3369 | 3285 | 835.8 |
| D | 13 | 122 | 301605 | 356.94 | 3369 | 3285 | 835.8 |
Histogram calculated using DETX and DETY for each event in the final _common_clean file
| Quadrant A |  |
 |
Quadrant B |
|---|---|---|---|
| Quadrant D |  |
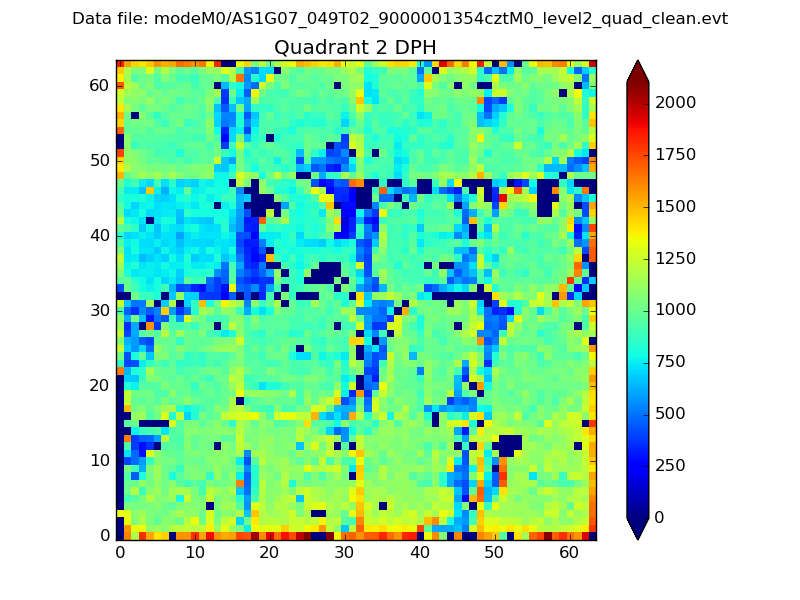 |
Quadrant C |
| Plot type | Count rate plots | Images |
|---|---|---|
| Comparison with Poisson distribution Blue bars denote a histogram of data divided into 1 sec bins. Red curve is a Poisson curve with rate = median count rate of data. |
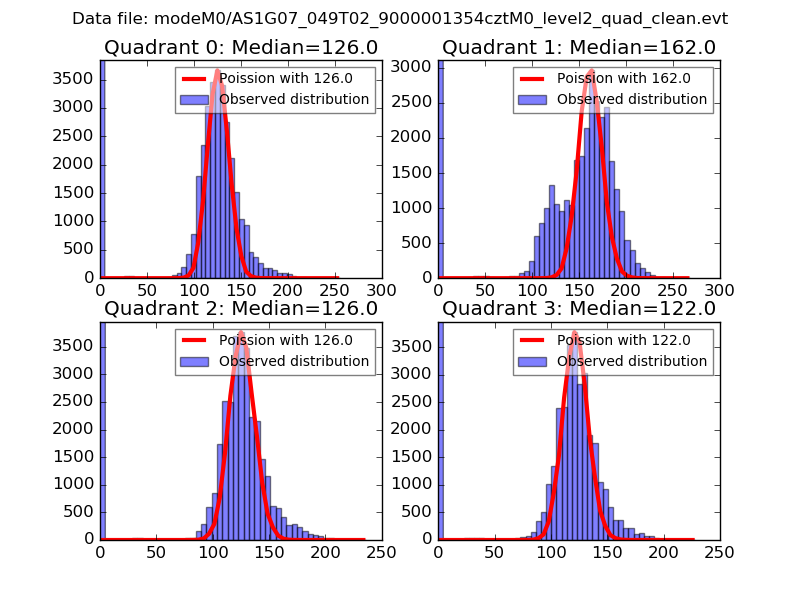 |
 |
| Quadrant-wise count rates Data is divided into 100 sec bins |
 |
|
| Module-wise count rates for Quadrant A Data is divided into 100 sec bins |
 |
 |
| Module-wise count rates for Quadrant B Data is divided into 100 sec bins |
 |
 |
| Module-wise count rates for Quadrant C Data is divided into 100 sec bins |
 |
 |
| Module-wise count rates for Quadrant D Data is divided into 100 sec bins |
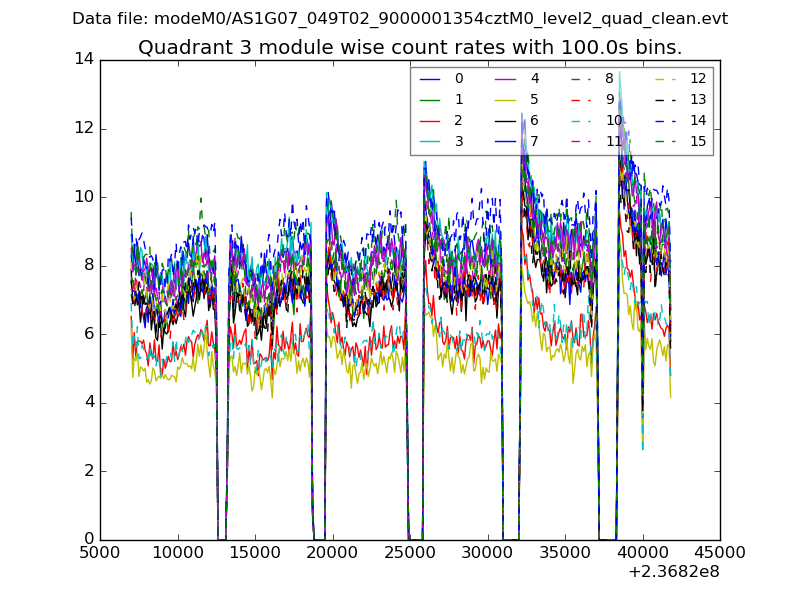 |
 |
| Parameter | Plot |
|---|---|
| CZT HV Monitor |  |
| D_VDD | 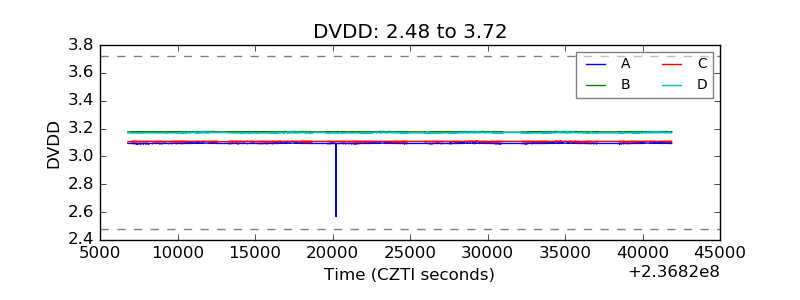 |
| Temperature 1 |  |
| Veto HV Monitor |  |
| Veto LLD |  |
| Alpha Counter | 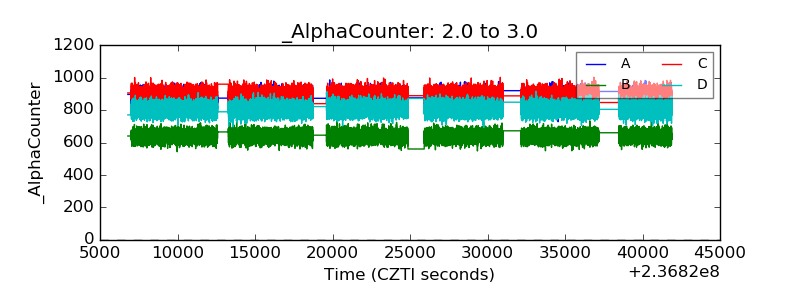 |
| _CPM_Rate | 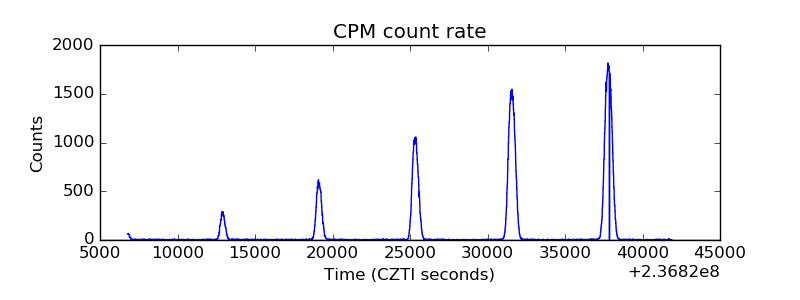 |
| CZT Counter |  |
| +2.5 Volts monitor | 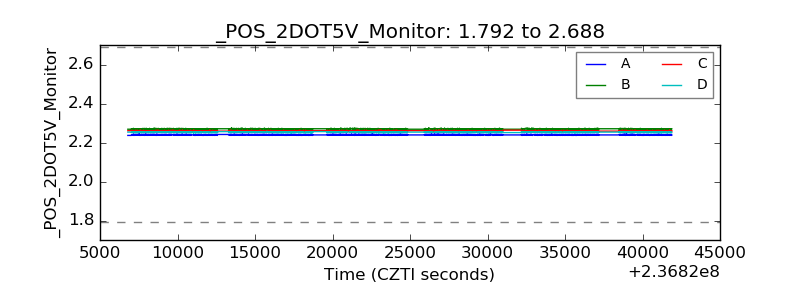 |
| +5 Volts monitor | 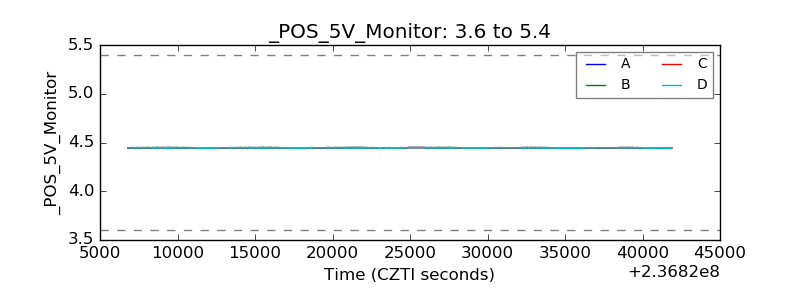 |
| _ROLL_ROT |  |
| _Roll_DEC |  |
| _Roll_RA |  |
| Veto Counter |  |