| Param | Original file | Final file |
|---|---|---|
| Filename | modeM0/AS1G05_230T06_9000001350cztM0_level2.evt | modeM0/AS1G05_230T06_9000001350cztM0_level2_quad_clean.evt |
| Size (bytes) | 10,548,529,920 | 1,854,547,200 |
| Size | 9.8 GB | 1.7 GB |
| Events in quadrant A | 86,459,362 | 11,628,577 |
| Events in quadrant B | 69,923,623 | 11,964,603 |
| Events in quadrant C | 72,115,052 | 11,651,384 |
| Events in quadrant D | 81,385,059 | 11,194,417 |
| Mode SS | |||
|---|---|---|---|
| Quadrant | BADHDUFLAG | Total packets | Discarded packets |
| A | 0 | 2856 | 0 |
| B | 0 | 2914 | 0 |
| C | 0 | 2912 | 0 |
| D | 0 | 2902 | 0 |
| Mode M9 | |||
|---|---|---|---|
| Quadrant | BADHDUFLAG | Total packets | Discarded packets |
| A | 0 | 234 | 0 |
| B | 0 | 237 | 0 |
| C | 0 | 236 | 0 |
| D | 0 | 235 | 0 |
| Mode M0 | |||
|---|---|---|---|
| Quadrant | BADHDUFLAG | Total packets | Discarded packets |
| A | 0 | 351779 | 0 |
| B | 0 | 300076 | 0 |
| C | 0 | 313065 | 0 |
| D | 0 | 336262 | 0 |
| Quadrant | Total seconds | Saturated seconds | Saturation percentage |
|---|---|---|---|
| A | 140865 | 2512 | 1.783268% |
| B | 142440 | 1491 | 1.046757% |
| C | 142724 | 4271 | 2.992489% |
| D | 141797 | 2678 | 1.888615% |
Noise dominated data is calculated using 1-second bins in cleaned event files. If a bin has >2000 counts, and if more than 50% of those come from <1% of pixels, then it is considered to be noise-dominated and hence unusable.
| Quadrant | # 1 sec bins | Bins with >0 counts | Bins with >2000 counts | High rate bins dominated by noise | Noise dominated (total time) | Noise dominated (detector-on time) | Marked lightcurve |
|---|---|---|---|---|---|---|---|
| A | 185447 | 147497 | 299 | 299 | 0.16% | 0.20% | 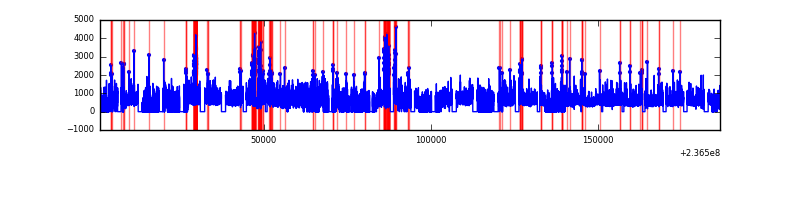 |
| B | 185447 | 148620 | 57 | 57 | 0.03% | 0.04% |  |
| C | 185447 | 149243 | 1559 | 1559 | 0.84% | 1.04% | 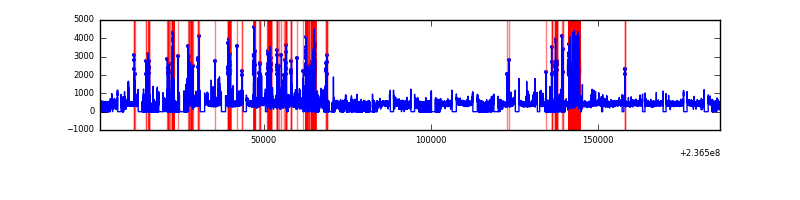 |
| D | 185447 | 148366 | 1548 | 1548 | 0.83% | 1.04% | 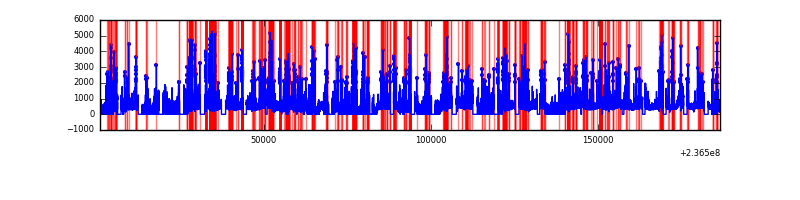 |
Top three noisy pixels from each quadrant. If the there are fewer than three noisy pixels in the level2.evt file, extra rows are filled as -1
| Pixel properties | Quadrant properties | ||||||
|---|---|---|---|---|---|---|---|
| Quadrant | DetID | PixID | Counts | Sigma | Mean | Median | Sigma |
| A | 8 | 5 | 11047307 | 3234.08 | 17025 | 16729 | 3410.7 |
| A | 1 | 162 | 4252493 | 1241.89 | 17025 | 16729 | 3410.7 |
| A | 1 | 178 | 1828973 | 531.34 | 17025 | 16729 | 3410.7 |
| B | 0 | 214 | 1098933 | 331.81 | 17286 | 16877 | 3261.1 |
| B | 0 | 219 | 558325 | 166.03 | 17286 | 16877 | 3261.1 |
| B | 12 | 111 | 354503 | 103.53 | 17286 | 16877 | 3261.1 |
| C | 4 | 254 | 7690616 | 2034.75 | 16404 | 16477 | 3771.5 |
| C | 9 | 68 | 258610 | 64.2 | 16404 | 16477 | 3771.5 |
| C | 14 | 234 | 148947 | 35.12 | 16404 | 16477 | 3771.5 |
| D | 8 | 195 | 4940475 | 1206.57 | 16437 | 16032 | 4081.4 |
| D | 1 | 52 | 4802752 | 1172.82 | 16437 | 16032 | 4081.4 |
| D | 12 | 233 | 3105384 | 756.94 | 16437 | 16032 | 4081.4 |
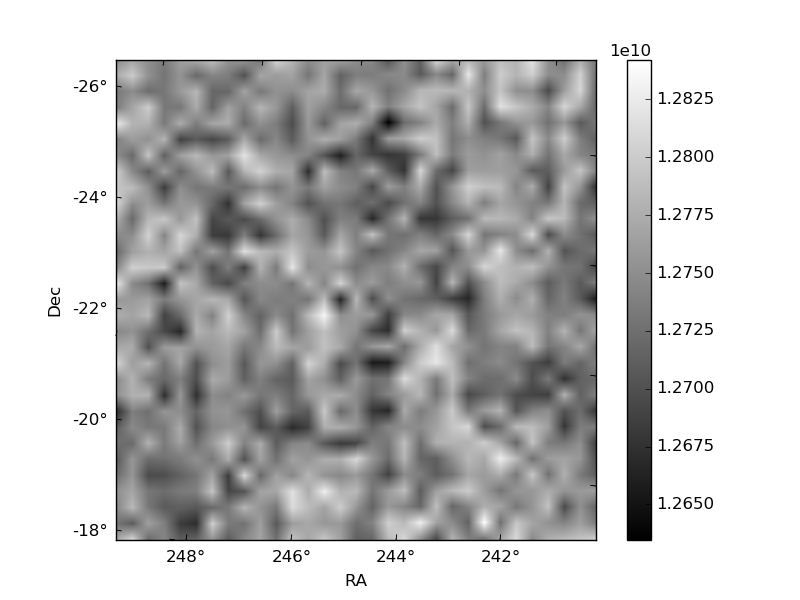
Histogram calculated using DETX and DETY for each event in the final _common_clean file
| Quadrant A |  |
 |
Quadrant B |
|---|---|---|---|
| Quadrant D |  |
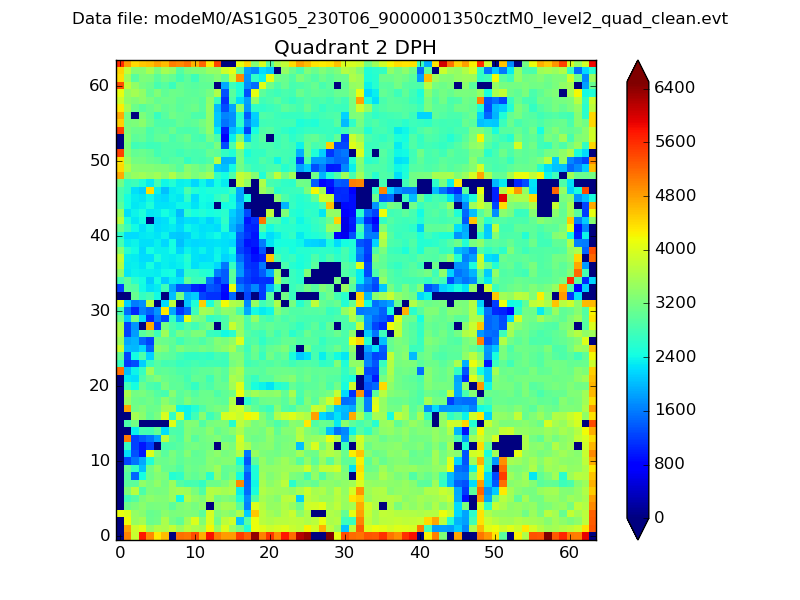 |
Quadrant C |
| Plot type | Count rate plots | Images |
|---|---|---|
| Comparison with Poisson distribution Blue bars denote a histogram of data divided into 1 sec bins. Red curve is a Poisson curve with rate = median count rate of data. |
 |
 |
| Quadrant-wise count rates Data is divided into 100 sec bins |
 |
|
| Module-wise count rates for Quadrant A Data is divided into 100 sec bins |
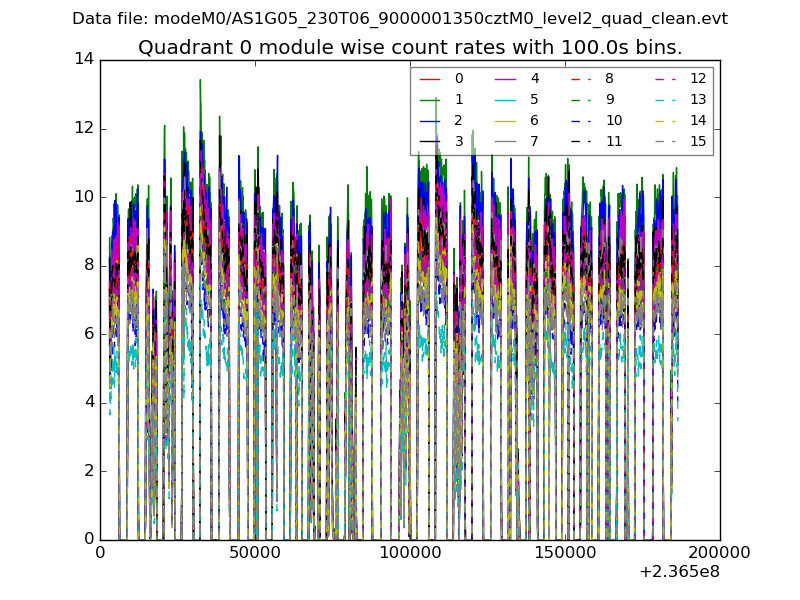 |
 |
| Module-wise count rates for Quadrant B Data is divided into 100 sec bins |
 |
 |
| Module-wise count rates for Quadrant C Data is divided into 100 sec bins |
 |
 |
| Module-wise count rates for Quadrant D Data is divided into 100 sec bins |
 |
 |
| Parameter | Plot |
|---|---|
| CZT HV Monitor |  |
| D_VDD |  |
| Temperature 1 |  |
| Veto HV Monitor | 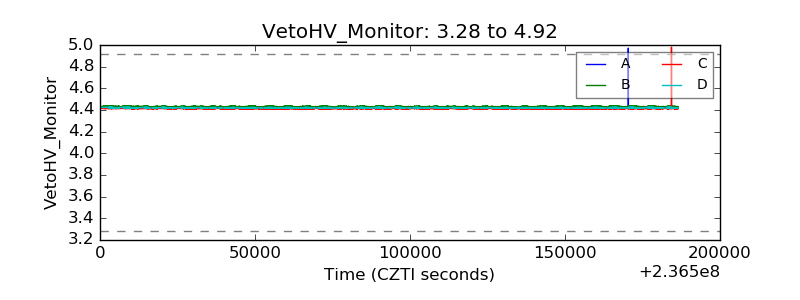 |
| Veto LLD | 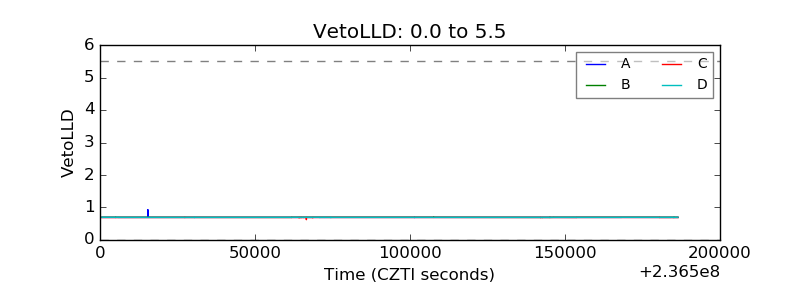 |
| Alpha Counter |  |
| _CPM_Rate | 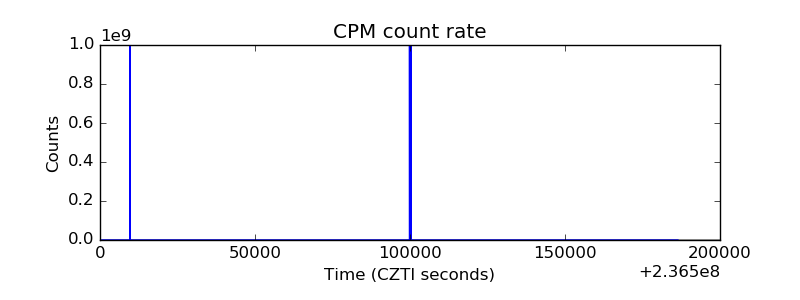 |
| CZT Counter |  |
| +2.5 Volts monitor |  |
| +5 Volts monitor |  |
| _ROLL_ROT |  |
| _Roll_DEC |  |
| _Roll_RA | 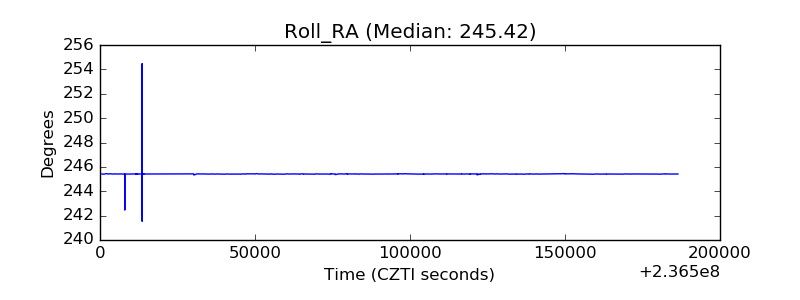 |
| Veto Counter |  |