| Param | Original file | Final file |
|---|---|---|
| Filename | modeM0/AS1C02_045T01_9000001342cztM0_level2.evt | modeM0/AS1C02_045T01_9000001342cztM0_level2_quad_clean.evt |
| Size (bytes) | 1,330,395,840 | 290,105,280 |
| Size | 1.2 GB | 276.7 MB |
| Events in quadrant A | 11,060,895 | 1,864,312 |
| Events in quadrant B | 9,307,667 | 1,887,606 |
| Events in quadrant C | 8,828,964 | 1,876,755 |
| Events in quadrant D | 9,795,095 | 1,835,470 |
| Mode M9 | |||
|---|---|---|---|
| Quadrant | BADHDUFLAG | Total packets | Discarded packets |
| A | 1 | 273359709408 | 0 |
| B | 1 | 273359709408 | 0 |
| C | 1 | 273359709408 | 0 |
| D | 1 | 273359709408 | 0 |
| Mode SS | |||
|---|---|---|---|
| Quadrant | BADHDUFLAG | Total packets | Discarded packets |
| A | 0 | 398 | 0 |
| B | 0 | 394 | 0 |
| C | 0 | 390 | 0 |
| D | 0 | 396 | 0 |
| Mode M0 | |||
|---|---|---|---|
| Quadrant | BADHDUFLAG | Total packets | Discarded packets |
| A | 0 | 45203 | 0 |
| B | 0 | 40341 | 0 |
| C | 0 | 39982 | 0 |
| D | 0 | 42567 | 0 |
| Quadrant | Total seconds | Saturated seconds | Saturation percentage |
|---|---|---|---|
| A | 19170 | 224 | 1.168492% |
| B | 19207 | 192 | 0.999636% |
| C | 19180 | 105 | 0.547445% |
| D | 19199 | 217 | 1.130267% |
Noise dominated data is calculated using 1-second bins in cleaned event files. If a bin has >2000 counts, and if more than 50% of those come from <1% of pixels, then it is considered to be noise-dominated and hence unusable.
| Quadrant | # 1 sec bins | Bins with >0 counts | Bins with >2000 counts | High rate bins dominated by noise | Noise dominated (total time) | Noise dominated (detector-on time) | Marked lightcurve |
|---|---|---|---|---|---|---|---|
| A | 22558 | 19314 | 47 | 47 | 0.21% | 0.24% | 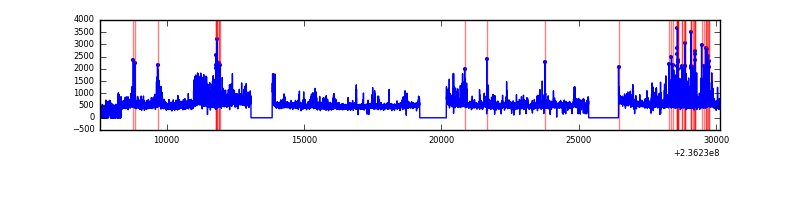 |
| B | 22558 | 19375 | 72 | 72 | 0.32% | 0.37% |  |
| C | 22558 | 19355 | 26 | 26 | 0.12% | 0.13% |  |
| D | 22535 | 19366 | 117 | 117 | 0.52% | 0.60% |  |
Top three noisy pixels from each quadrant. If the there are fewer than three noisy pixels in the level2.evt file, extra rows are filled as -1
| Pixel properties | Quadrant properties | ||||||
|---|---|---|---|---|---|---|---|
| Quadrant | DetID | PixID | Counts | Sigma | Mean | Median | Sigma |
| A | 8 | 5 | 2204716 | 5001.5 | 2188 | 2142 | 440.4 |
| A | 1 | 162 | 216622 | 487.03 | 2188 | 2142 | 440.4 |
| A | 1 | 178 | 74988 | 165.41 | 2188 | 2142 | 440.4 |
| B | 0 | 187 | 298777 | 727.06 | 2181 | 2122 | 408.0 |
| B | 0 | 214 | 196814 | 477.16 | 2181 | 2122 | 408.0 |
| B | 0 | 219 | 102966 | 247.15 | 2181 | 2122 | 408.0 |
| C | 9 | 68 | 380189 | 779.19 | 2120 | 2129 | 485.2 |
| C | 4 | 254 | 163265 | 332.11 | 2120 | 2129 | 485.2 |
| C | 13 | 61 | 15984 | 28.56 | 2120 | 2129 | 485.2 |
| D | 1 | 52 | 933531 | 1748.08 | 2124 | 2075 | 532.8 |
| D | 12 | 233 | 281774 | 524.91 | 2124 | 2075 | 532.8 |
| D | 7 | 71 | 166741 | 309.03 | 2124 | 2075 | 532.8 |
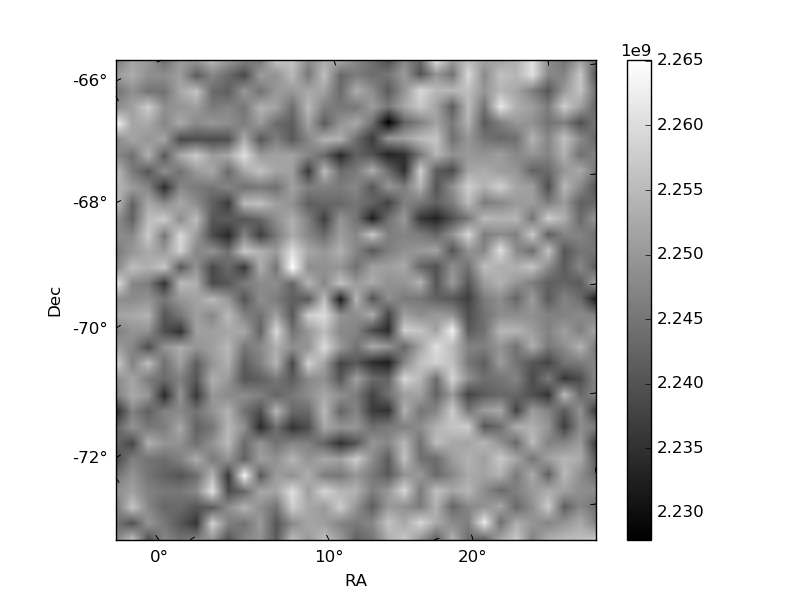
Histogram calculated using DETX and DETY for each event in the final _common_clean file
| Quadrant A |  |
 |
Quadrant B |
|---|---|---|---|
| Quadrant D |  |
 |
Quadrant C |
| Plot type | Count rate plots | Images |
|---|---|---|
| Comparison with Poisson distribution Blue bars denote a histogram of data divided into 1 sec bins. Red curve is a Poisson curve with rate = median count rate of data. |
 |
 |
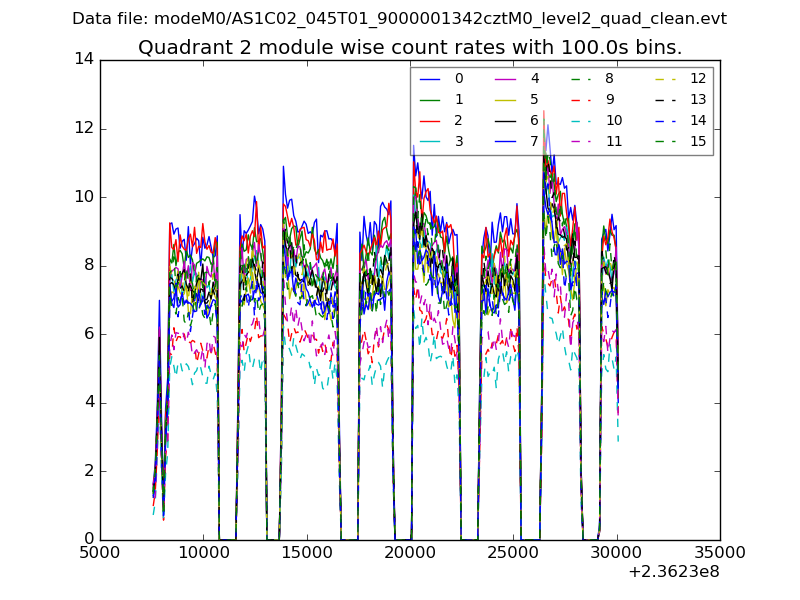
| Quadrant-wise count rates Data is divided into 100 sec bins |
 |
|
| Module-wise count rates for Quadrant A Data is divided into 100 sec bins |
 |
 |
| Module-wise count rates for Quadrant B Data is divided into 100 sec bins |
 |
 |
| Module-wise count rates for Quadrant C Data is divided into 100 sec bins |
 |
 |
| Module-wise count rates for Quadrant D Data is divided into 100 sec bins |
 |
 |
| Parameter | Plot |
|---|---|
| CZT HV Monitor |  |
| D_VDD |  |
| Temperature 1 | 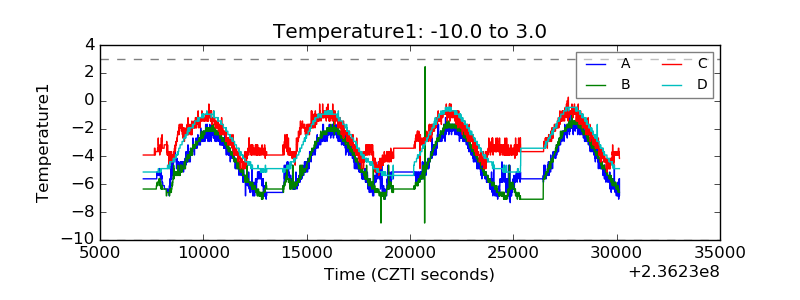 |
| Veto HV Monitor |  |
| Veto LLD | 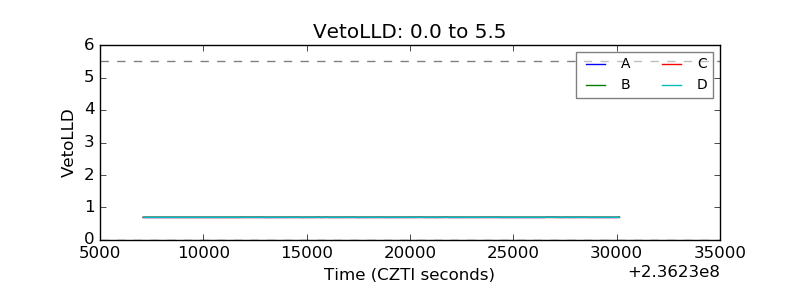 |
| Alpha Counter |  |
| _CPM_Rate |  |
| CZT Counter |  |
| +2.5 Volts monitor |  |
| +5 Volts monitor |  |
| _ROLL_ROT |  |
| _Roll_DEC | 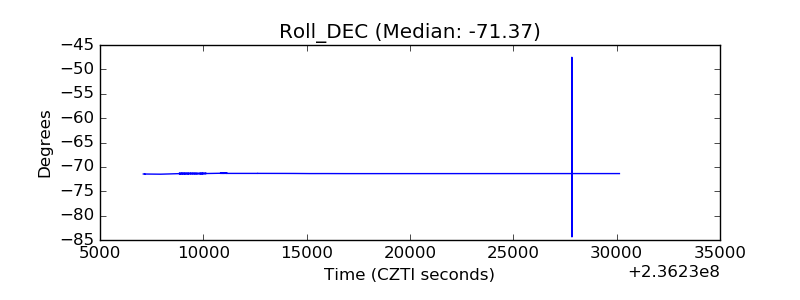 |
| _Roll_RA |  |
| Veto Counter |  |