| Param | Original file | Final file |
|---|---|---|
| Filename | modeM0/AS1G07_063T01_9000001336cztM0_level2.evt | modeM0/AS1G07_063T01_9000001336cztM0_level2_quad_clean.evt |
| Size (bytes) | 1,577,361,600 | 217,621,440 |
| Size | 1.5 GB | 207.5 MB |
| Events in quadrant A | 12,238,367 | 1,330,597 |
| Events in quadrant B | 8,819,444 | 1,396,064 |
| Events in quadrant C | 14,418,489 | 1,252,373 |
| Events in quadrant D | 11,003,792 | 1,295,611 |
| Mode M0 | |||
|---|---|---|---|
| Quadrant | BADHDUFLAG | Total packets | Discarded packets |
| A | 0 | 49196 | 0 |
| B | 0 | 39606 | 0 |
| C | 0 | 55588 | 0 |
| D | 0 | 46669 | 0 |
| Mode M9 | |||
|---|---|---|---|
| Quadrant | BADHDUFLAG | Total packets | Discarded packets |
| A | 0 | 13 | 0 |
| B | 0 | 13 | 0 |
| C | 0 | 13 | 0 |
| D | 0 | 12 | 0 |
| Mode SS | |||
|---|---|---|---|
| Quadrant | BADHDUFLAG | Total packets | Discarded packets |
| A | 0 | 384 | 0 |
| B | 0 | 390 | 0 |
| C | 0 | 390 | 0 |
| D | 0 | 402 | 0 |
| Quadrant | Total seconds | Saturated seconds | Saturation percentage |
|---|---|---|---|
| A | 19037 | 307 | 1.612649% |
| B | 19475 | 194 | 0.996149% |
| C | 18409 | 2311 | 12.553642% |
| D | 19309 | 601 | 3.112538% |
Noise dominated data is calculated using 1-second bins in cleaned event files. If a bin has >2000 counts, and if more than 50% of those come from <1% of pixels, then it is considered to be noise-dominated and hence unusable.
| Quadrant | # 1 sec bins | Bins with >0 counts | Bins with >2000 counts | High rate bins dominated by noise | Noise dominated (total time) | Noise dominated (detector-on time) | Marked lightcurve |
|---|---|---|---|---|---|---|---|
| A | 22886 | 20581 | 53 | 53 | 0.23% | 0.26% |  |
| B | 22887 | 20782 | 1 | 1 | 0.00% | 0.00% |  |
| C | 22886 | 19925 | 1656 | 1656 | 7.24% | 8.31% |  |
| D | 22887 | 20756 | 379 | 379 | 1.66% | 1.83% |  |
Top three noisy pixels from each quadrant. If the there are fewer than three noisy pixels in the level2.evt file, extra rows are filled as -1
| Pixel properties | Quadrant properties | ||||||
|---|---|---|---|---|---|---|---|
| Quadrant | DetID | PixID | Counts | Sigma | Mean | Median | Sigma |
| A | 8 | 5 | 3601259 | 7971.2 | 2196 | 2147 | 451.5 |
| A | 1 | 162 | 99427 | 215.45 | 2196 | 2147 | 451.5 |
| A | 1 | 178 | 29538 | 60.66 | 2196 | 2147 | 451.5 |
| B | 12 | 111 | 50897 | 112.06 | 2260 | 2200 | 434.5 |
| B | 11 | 111 | 41189 | 89.72 | 2260 | 2200 | 434.5 |
| B | 14 | 111 | 30890 | 66.02 | 2260 | 2200 | 434.5 |
| C | 4 | 254 | 6230029 | 13790.38 | 1955 | 1963 | 451.6 |
| C | 9 | 68 | 550010 | 1213.5 | 1955 | 1963 | 451.6 |
| C | 13 | 61 | 14663 | 28.12 | 1955 | 1963 | 451.6 |
| D | 1 | 52 | 2147104 | 3954.85 | 2139 | 2089 | 542.4 |
| D | 13 | 122 | 464767 | 853.06 | 2139 | 2089 | 542.4 |
| D | 2 | 234 | 75471 | 135.3 | 2139 | 2089 | 542.4 |
Histogram calculated using DETX and DETY for each event in the final _common_clean file
| Quadrant A |  |
 |
Quadrant B |
|---|---|---|---|
| Quadrant D |  |
 |
Quadrant C |
| Plot type | Count rate plots | Images |
|---|---|---|
| Comparison with Poisson distribution Blue bars denote a histogram of data divided into 1 sec bins. Red curve is a Poisson curve with rate = median count rate of data. |
 |
 |
| Quadrant-wise count rates Data is divided into 100 sec bins |
 |
|
| Module-wise count rates for Quadrant A Data is divided into 100 sec bins |
 |
 |
| Module-wise count rates for Quadrant B Data is divided into 100 sec bins |
 |
 |
| Module-wise count rates for Quadrant C Data is divided into 100 sec bins |
 |
 |
| Module-wise count rates for Quadrant D Data is divided into 100 sec bins |
 |
 |
| Parameter | Plot |
|---|---|
| CZT HV Monitor |  |
| D_VDD |  |
| Temperature 1 |  |
| Veto HV Monitor |  |
| Veto LLD |  |
| Alpha Counter |  |
| _CPM_Rate |  |
| CZT Counter |  |
| +2.5 Volts monitor | 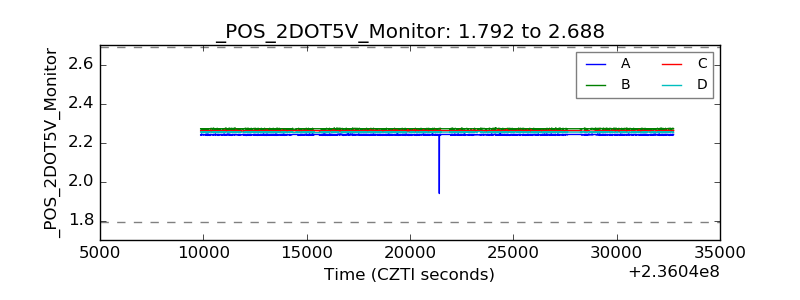 |
| +5 Volts monitor |  |
| _ROLL_ROT |  |
| _Roll_DEC |  |
| _Roll_RA |  |
| Veto Counter |  |