| Param | Original file | Final file |
|---|---|---|
| Filename | modeM0/AS1G07_030T01_9000001338cztM0_level2.evt | modeM0/AS1G07_030T01_9000001338cztM0_level2_quad_clean.evt |
| Size (bytes) | 2,559,654,720 | 313,277,760 |
| Size | 2.4 GB | 298.8 MB |
| Events in quadrant A | 16,822,784 | 2,019,696 |
| Events in quadrant B | 13,200,840 | 2,077,025 |
| Events in quadrant C | 32,329,090 | 1,573,099 |
| Events in quadrant D | 13,350,738 | 1,964,088 |
| Mode M0 | |||
|---|---|---|---|
| Quadrant | BADHDUFLAG | Total packets | Discarded packets |
| A | 0 | 67757 | 0 |
| B | 0 | 56602 | 0 |
| C | 0 | 114261 | 0 |
| D | 0 | 57449 | 0 |
| Mode M9 | |||
|---|---|---|---|
| Quadrant | BADHDUFLAG | Total packets | Discarded packets |
| A | 0 | 65 | 0 |
| B | 0 | 63 | 0 |
| C | 0 | 64 | 0 |
| D | 0 | 63 | 0 |
| Mode SS | |||
|---|---|---|---|
| Quadrant | BADHDUFLAG | Total packets | Discarded packets |
| A | 0 | 548 | 0 |
| B | 0 | 548 | 0 |
| C | 0 | 546 | 0 |
| D | 0 | 548 | 0 |
| Quadrant | Total seconds | Saturated seconds | Saturation percentage |
|---|---|---|---|
| A | 26794 | 542 | 2.022841% |
| B | 27039 | 395 | 1.460853% |
| C | 26875 | 8180 | 30.437209% |
| D | 26985 | 346 | 1.282194% |
Noise dominated data is calculated using 1-second bins in cleaned event files. If a bin has >2000 counts, and if more than 50% of those come from <1% of pixels, then it is considered to be noise-dominated and hence unusable.
| Quadrant | # 1 sec bins | Bins with >0 counts | Bins with >2000 counts | High rate bins dominated by noise | Noise dominated (total time) | Noise dominated (detector-on time) | Marked lightcurve |
|---|---|---|---|---|---|---|---|
| A | 34771 | 27832 | 52 | 52 | 0.15% | 0.19% | 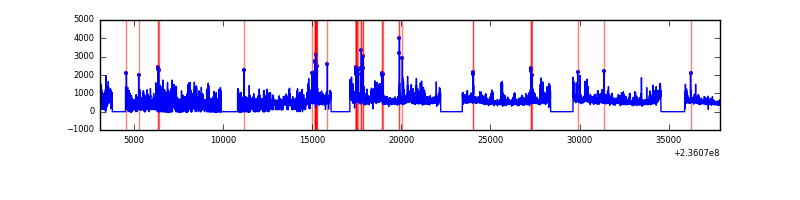 |
| B | 34771 | 27943 | 1 | 1 | 0.00% | 0.00% |  |
| C | 34771 | 27853 | 5638 | 5638 | 16.21% | 20.24% |  |
| D | 34771 | 27891 | 31 | 31 | 0.09% | 0.11% | 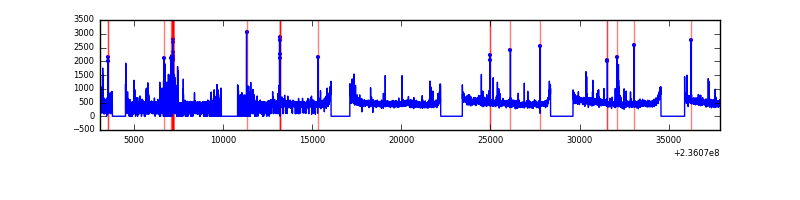 |
Top three noisy pixels from each quadrant. If the there are fewer than three noisy pixels in the level2.evt file, extra rows are filled as -1
| Pixel properties | Quadrant properties | ||||||
|---|---|---|---|---|---|---|---|
| Quadrant | DetID | PixID | Counts | Sigma | Mean | Median | Sigma |
| A | 8 | 5 | 3511118 | 5245.45 | 3337 | 3274 | 668.7 |
| A | 4 | 2 | 261707 | 386.45 | 3337 | 3274 | 668.7 |
| A | 1 | 162 | 96099 | 138.8 | 3337 | 3274 | 668.7 |
| B | 12 | 111 | 71962 | 107.87 | 3386 | 3312 | 636.4 |
| B | 11 | 111 | 58234 | 86.3 | 3386 | 3312 | 636.4 |
| B | 14 | 111 | 44115 | 64.11 | 3386 | 3312 | 636.4 |
| C | 4 | 254 | 21735783 | 35532.26 | 2672 | 2685 | 611.6 |
| C | 9 | 68 | 77313 | 122.01 | 2672 | 2685 | 611.6 |
| C | 14 | 234 | 52362 | 81.22 | 2672 | 2685 | 611.6 |
| D | 8 | 195 | 360516 | 434.02 | 3268 | 3190 | 823.3 |
| D | 1 | 52 | 301145 | 361.9 | 3268 | 3190 | 823.3 |
| D | 2 | 234 | 106920 | 125.99 | 3268 | 3190 | 823.3 |
Histogram calculated using DETX and DETY for each event in the final _common_clean file
| Quadrant A |  |
 |
Quadrant B |
|---|---|---|---|
| Quadrant D |  |
 |
Quadrant C |
| Plot type | Count rate plots | Images |
|---|---|---|
| Comparison with Poisson distribution Blue bars denote a histogram of data divided into 1 sec bins. Red curve is a Poisson curve with rate = median count rate of data. |
 |
 |
| Quadrant-wise count rates Data is divided into 100 sec bins |
 |
|
| Module-wise count rates for Quadrant A Data is divided into 100 sec bins |
 |
 |
| Module-wise count rates for Quadrant B Data is divided into 100 sec bins |
 |
 |
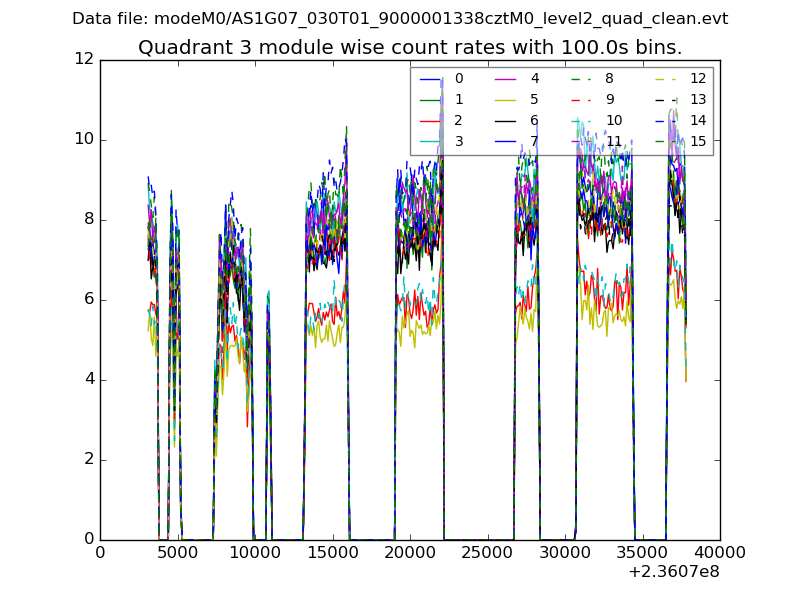
| Module-wise count rates for Quadrant C Data is divided into 100 sec bins |
 |
 |
| Module-wise count rates for Quadrant D Data is divided into 100 sec bins |
 |
 |
| Parameter | Plot |
|---|---|
| CZT HV Monitor |  |
| D_VDD |  |
| Temperature 1 | 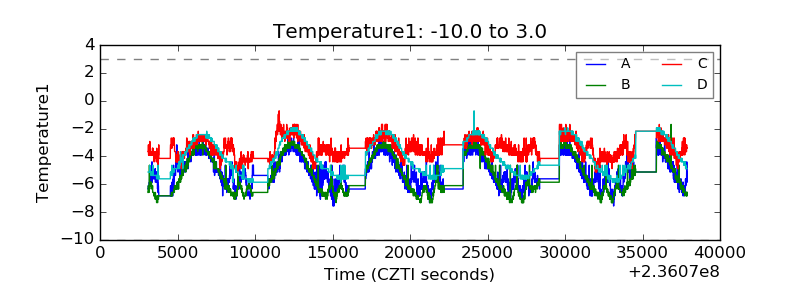 |
| Veto HV Monitor | 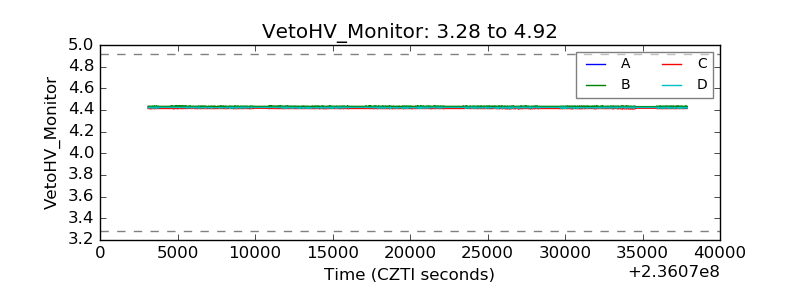 |
| Veto LLD |  |
| Alpha Counter |  |
| _CPM_Rate |  |
| CZT Counter | 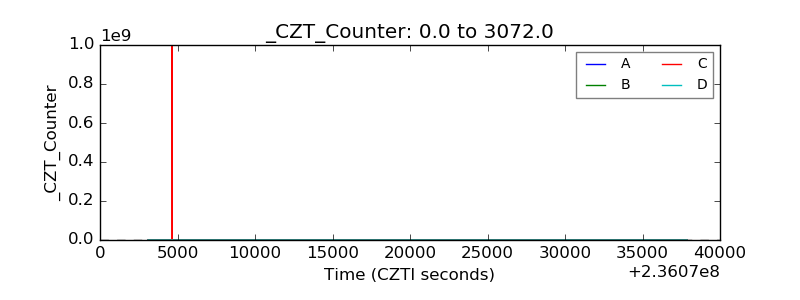 |
| +2.5 Volts monitor |  |
| +5 Volts monitor |  |
| _ROLL_ROT |  |
| _Roll_DEC |  |
| _Roll_RA |  |
| Veto Counter |  |