| Param | Original file | Final file |
|---|---|---|
| Filename | modeM0/AS1A02_178T01_9000001340cztM0_level2_bc.evt | modeM0/AS1A02_178T01_9000001340cztM0_level2_quad_clean.evt |
| Size (bytes) | 2,853,483,840 | 995,947,200 |
| Size | 2.7 GB | 949.8 MB |
| Events in quadrant A | 21,580,812 | 6,590,457 |
| Events in quadrant B | 17,690,239 | 6,585,612 |
| Events in quadrant C | 21,349,857 | 5,142,346 |
| Events in quadrant D | 20,339,994 | 6,362,977 |
| Mode SS | |||
|---|---|---|---|
| Quadrant | BADHDUFLAG | Total packets | Discarded packets |
| A | 0 | 1898 | 0 |
| B | 0 | 1900 | 0 |
| C | 0 | 1906 | 0 |
| D | 0 | 1917 | 0 |
| Mode M0 | |||
|---|---|---|---|
| Quadrant | BADHDUFLAG | Total packets | Discarded packets |
| A | 0 | 186712 | 0 |
| B | 0 | 174509 | 0 |
| C | 0 | 183275 | 0 |
| D | 0 | 179341 | 0 |
| Mode M9 | |||
|---|---|---|---|
| Quadrant | BADHDUFLAG | Total packets | Discarded packets |
| A | 0 | 150 | 0 |
| B | 0 | 153 | 0 |
| C | 0 | 146 | 0 |
| D | 0 | 147 | 0 |
| Quadrant | Total seconds | Saturated seconds | Saturation percentage |
|---|---|---|---|
| A | 82506 | 1123 | 1.361113% |
| B | 82687 | 822 | 0.994110% |
| C | 68150 | 6411 | 9.407190% |
| D | 82631 | 741 | 0.896758% |
Noise dominated data is calculated using 1-second bins in cleaned event files. If a bin has >2000 counts, and if more than 50% of those come from <1% of pixels, then it is considered to be noise-dominated and hence unusable.
| Quadrant | # 1 sec bins | Bins with >0 counts | Bins with >2000 counts | High rate bins dominated by noise | Noise dominated (total time) | Noise dominated (detector-on time) | Marked lightcurve |
|---|---|---|---|---|---|---|---|
| A | 126811 | 86193 | 7 | 7 | 0.01% | 0.01% |  |
| B | 126811 | 86255 | 8 | 8 | 0.01% | 0.01% |  |
| C | 108262 | 70083 | 693 | 693 | 0.64% | 0.99% |  |
| D | 126811 | 86214 | 76 | 76 | 0.06% | 0.09% |  |
Top three noisy pixels from each quadrant. If the there are fewer than three noisy pixels in the level2.evt file, extra rows are filled as -1
| Pixel properties | Quadrant properties | ||||||
|---|---|---|---|---|---|---|---|
| Quadrant | DetID | PixID | Counts | Sigma | Mean | Median | Sigma |
| A | 8 | 5 | 4422648 | 4834.78 | 4194 | 4110 | 913.9 |
| A | 1 | 162 | 361176 | 390.7 | 4194 | 4110 | 913.9 |
| A | 4 | 2 | 292965 | 316.07 | 4194 | 4110 | 913.9 |
| B | 0 | 214 | 315298 | 388.49 | 4194 | 4075 | 801.1 |
| B | 0 | 219 | 297352 | 366.09 | 4194 | 4075 | 801.1 |
| B | 0 | 229 | 285974 | 351.88 | 4194 | 4075 | 801.1 |
| C | 4 | 254 | 8288306 | 11871.31 | 3178 | 3120 | 697.9 |
| C | 9 | 68 | 427363 | 607.87 | 3178 | 3120 | 697.9 |
| C | 14 | 234 | 156665 | 220.0 | 3178 | 3120 | 697.9 |
| D | 8 | 195 | 1781709 | 1771.83 | 4088 | 3963 | 1003.3 |
| D | 1 | 52 | 738124 | 731.72 | 4088 | 3963 | 1003.3 |
| D | 7 | 71 | 538812 | 533.07 | 4088 | 3963 | 1003.3 |
Histogram calculated using DETX and DETY for each event in the final _common_clean file
| Quadrant A |  |
 |
Quadrant B |
|---|---|---|---|
| Quadrant D |  |
 |
Quadrant C |
| Plot type | Count rate plots | Images |
|---|---|---|
| Comparison with Poisson distribution Blue bars denote a histogram of data divided into 1 sec bins. Red curve is a Poisson curve with rate = median count rate of data. |
 |
 |
| Quadrant-wise count rates Data is divided into 100 sec bins |
 |
|
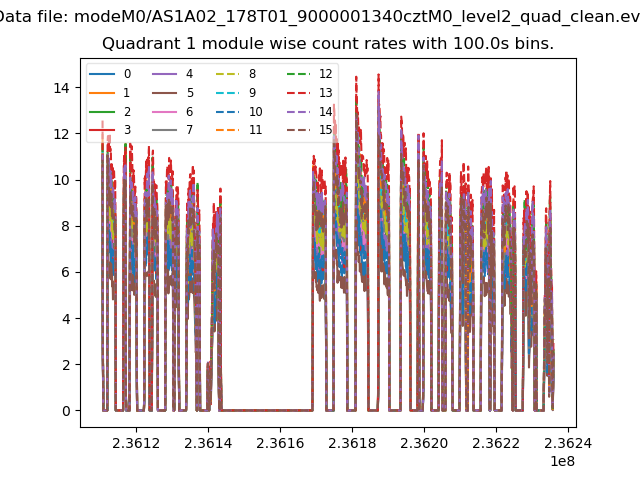
| Module-wise count rates for Quadrant A Data is divided into 100 sec bins |
 |
 |
| Module-wise count rates for Quadrant B Data is divided into 100 sec bins |
 |
 |
| Module-wise count rates for Quadrant C Data is divided into 100 sec bins |
 |
 |
| Module-wise count rates for Quadrant D Data is divided into 100 sec bins |
 |
 |
| Parameter | Plot |
|---|---|
| CZT HV Monitor |  |
| D_VDD |  |
| Temperature 1 |  |
| Veto HV Monitor |  |
| Veto LLD |  |
| Alpha Counter |  |
| _CPM_Rate |  |
| CZT Counter |  |
| +2.5 Volts monitor |  |
| +5 Volts monitor | 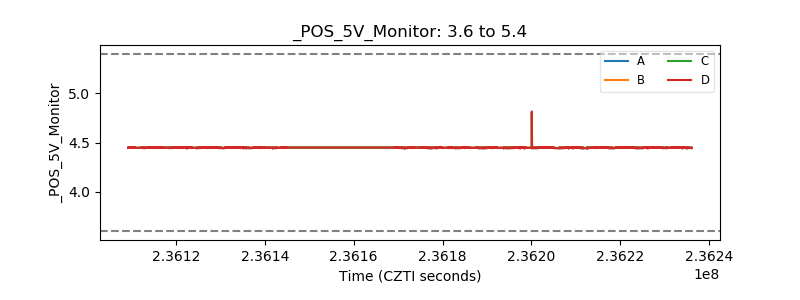 |
| _ROLL_ROT |  |
| _Roll_DEC |  |
| _Roll_RA |  |
| Veto Counter |  |