| Param | Original file | Final file |
|---|---|---|
| Filename | modeM0/AS1G07_044T09_9000001334cztM0_level2_bc.evt | modeM0/AS1G07_044T09_9000001334cztM0_level2_quad_clean.evt |
| Size (bytes) | 2,456,948,160 | 1,004,374,080 |
| Size | 2.3 GB | 957.8 MB |
| Events in quadrant A | 20,836,170 | 6,301,133 |
| Events in quadrant B | 15,228,330 | 6,382,906 |
| Events in quadrant C | 16,031,863 | 6,394,718 |
| Events in quadrant D | 17,206,698 | 6,209,228 |
| Mode M0 | |||
|---|---|---|---|
| Quadrant | BADHDUFLAG | Total packets | Discarded packets |
| A | 0 | 172203 | 0 |
| B | 0 | 155709 | 0 |
| C | 0 | 158780 | 0 |
| D | 0 | 160095 | 0 |
| Mode M9 | |||
|---|---|---|---|
| Quadrant | BADHDUFLAG | Total packets | Discarded packets |
| A | 0 | 115 | 0 |
| B | 0 | 115 | 0 |
| C | 0 | 115 | 0 |
| D | 0 | 115 | 0 |
| Mode SS | |||
|---|---|---|---|
| Quadrant | BADHDUFLAG | Total packets | Discarded packets |
| A | 0 | 1526 | 0 |
| B | 0 | 1524 | 0 |
| C | 0 | 1524 | 0 |
| D | 0 | 1522 | 0 |
| Quadrant | Total seconds | Saturated seconds | Saturation percentage |
|---|---|---|---|
| A | 74891 | 1276 | 1.703810% |
| B | 74903 | 931 | 1.242941% |
| C | 74902 | 1011 | 1.349764% |
| D | 74882 | 974 | 1.300713% |
Noise dominated data is calculated using 1-second bins in cleaned event files. If a bin has >2000 counts, and if more than 50% of those come from <1% of pixels, then it is considered to be noise-dominated and hence unusable.
| Quadrant | # 1 sec bins | Bins with >0 counts | Bins with >2000 counts | High rate bins dominated by noise | Noise dominated (total time) | Noise dominated (detector-on time) | Marked lightcurve |
|---|---|---|---|---|---|---|---|
| A | 86390 | 74996 | 98 | 98 | 0.11% | 0.13% |  |
| B | 86390 | 74990 | 1 | 1 | 0.00% | 0.00% |  |
| C | 86390 | 74994 | 11 | 11 | 0.01% | 0.01% |  |
| D | 86390 | 74989 | 49 | 49 | 0.06% | 0.07% |  |
Top three noisy pixels from each quadrant. If the there are fewer than three noisy pixels in the level2.evt file, extra rows are filled as -1
| Pixel properties | Quadrant properties | ||||||
|---|---|---|---|---|---|---|---|
| Quadrant | DetID | PixID | Counts | Sigma | Mean | Median | Sigma |
| A | 8 | 5 | 4950037 | 6084.64 | 3708 | 3642 | 812.9 |
| A | 4 | 2 | 445286 | 543.27 | 3708 | 3642 | 812.9 |
| A | 5 | 16 | 326760 | 397.47 | 3708 | 3642 | 812.9 |
| B | 0 | 214 | 314296 | 441.04 | 3747 | 3646 | 704.4 |
| B | 0 | 219 | 314118 | 440.79 | 3747 | 3646 | 704.4 |
| B | 0 | 187 | 80142 | 108.6 | 3747 | 3646 | 704.4 |
| C | 4 | 254 | 1408331 | 1725.64 | 3708 | 3649 | 814.0 |
| C | 10 | 22 | 56696 | 65.17 | 3708 | 3649 | 814.0 |
| C | 14 | 234 | 25431 | 26.76 | 3708 | 3649 | 814.0 |
| D | 1 | 52 | 910838 | 1060.51 | 3697 | 3590 | 855.5 |
| D | 8 | 195 | 536497 | 622.93 | 3697 | 3590 | 855.5 |
| D | 7 | 71 | 450082 | 521.92 | 3697 | 3590 | 855.5 |
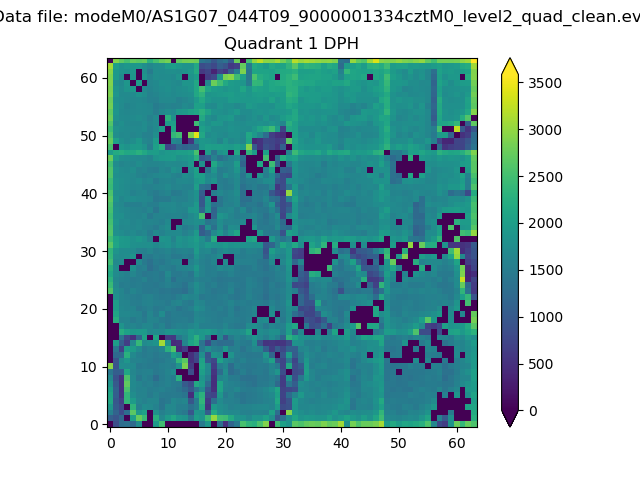
Histogram calculated using DETX and DETY for each event in the final _common_clean file
| Quadrant A |  |
 |
Quadrant B |
|---|---|---|---|
| Quadrant D | 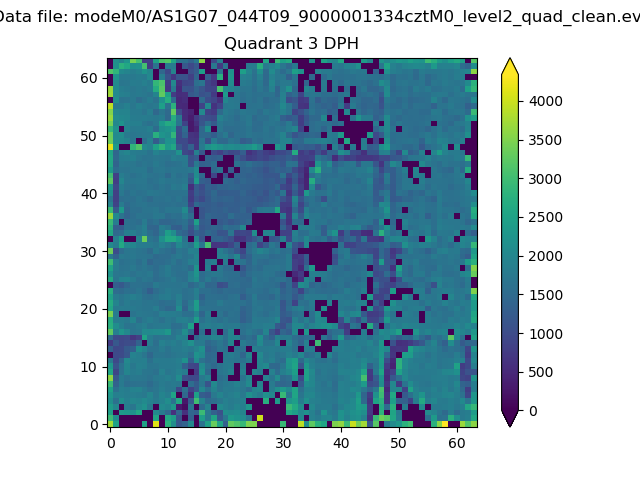 |
 |
Quadrant C |
| Plot type | Count rate plots | Images |
|---|---|---|
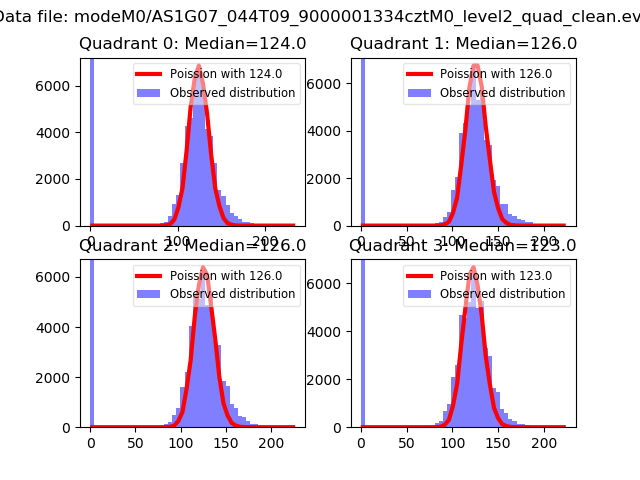
| Comparison with Poisson distribution Blue bars denote a histogram of data divided into 1 sec bins. Red curve is a Poisson curve with rate = median count rate of data. |
 |
 |
| Quadrant-wise count rates Data is divided into 100 sec bins |
 |
|
| Module-wise count rates for Quadrant A Data is divided into 100 sec bins |
 |
 |
| Module-wise count rates for Quadrant B Data is divided into 100 sec bins |
 |
 |
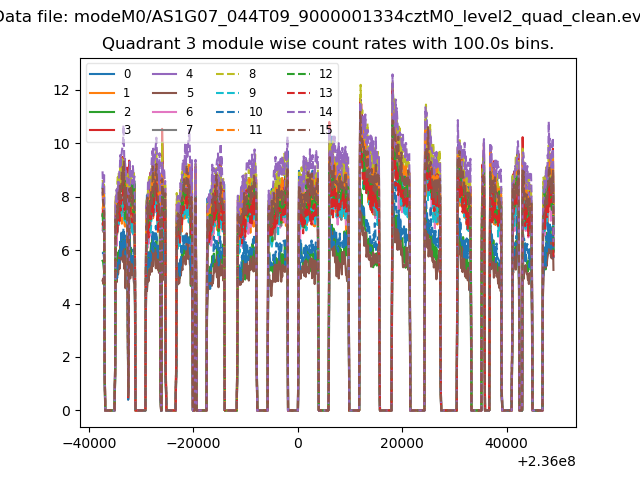
| Module-wise count rates for Quadrant C Data is divided into 100 sec bins |
 |
 |
| Module-wise count rates for Quadrant D Data is divided into 100 sec bins |
 |
 |
| Parameter | Plot |
|---|---|
| CZT HV Monitor | 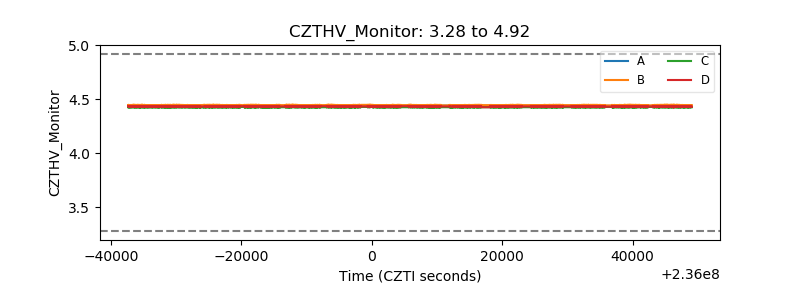 |
| D_VDD |  |
| Temperature 1 |  |
| Veto HV Monitor |  |
| Veto LLD |  |
| Alpha Counter |  |
| _CPM_Rate | 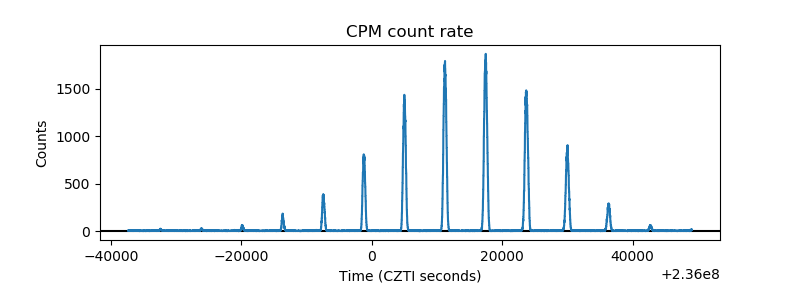 |
| CZT Counter |  |
| +2.5 Volts monitor |  |
| +5 Volts monitor |  |
| _ROLL_ROT | 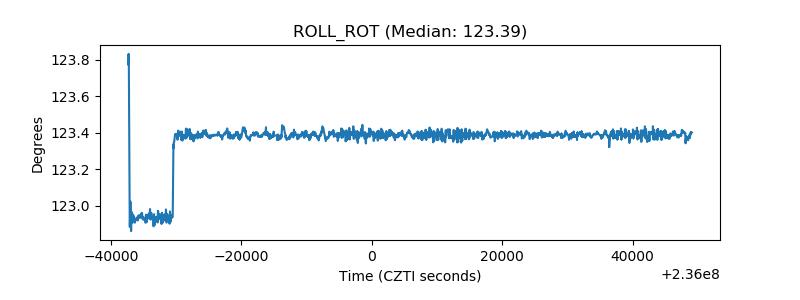 |
| _Roll_DEC |  |
| _Roll_RA |  |
| Veto Counter |  |