| Param | Original file | Final file |
|---|---|---|
| Filename | modeM0/AS1G07_069T01_9000001332cztM0_level2.evt | modeM0/AS1G07_069T01_9000001332cztM0_level2_quad_clean.evt |
| Size (bytes) | 5,084,075,520 | 874,578,240 |
| Size | 4.7 GB | 834.1 MB |
| Events in quadrant A | 37,491,597 | 5,600,077 |
| Events in quadrant B | 30,635,621 | 5,678,499 |
| Events in quadrant C | 29,364,517 | 5,717,361 |
| Events in quadrant D | 52,141,062 | 5,078,383 |
| Mode SS | |||
|---|---|---|---|
| Quadrant | BADHDUFLAG | Total packets | Discarded packets |
| A | 0 | 1316 | 0 |
| B | 0 | 1312 | 0 |
| C | 0 | 1312 | 0 |
| D | 0 | 1310 | 0 |
| Mode M9 | |||
|---|---|---|---|
| Quadrant | BADHDUFLAG | Total packets | Discarded packets |
| A | 0 | 118 | 0 |
| B | 0 | 118 | 0 |
| C | 0 | 118 | 0 |
| D | 0 | 118 | 0 |
| Mode M0 | |||
|---|---|---|---|
| Quadrant | BADHDUFLAG | Total packets | Discarded packets |
| A | 0 | 154232 | 0 |
| B | 0 | 134985 | 0 |
| C | 0 | 132729 | 0 |
| D | 0 | 199916 | 0 |
| Quadrant | Total seconds | Saturated seconds | Saturation percentage |
|---|---|---|---|
| A | 64360 | 1098 | 1.706029% |
| B | 64388 | 713 | 1.107349% |
| C | 64384 | 557 | 0.865122% |
| D | 64300 | 8816 | 13.710731% |
Noise dominated data is calculated using 1-second bins in cleaned event files. If a bin has >2000 counts, and if more than 50% of those come from <1% of pixels, then it is considered to be noise-dominated and hence unusable.
| Quadrant | # 1 sec bins | Bins with >0 counts | Bins with >2000 counts | High rate bins dominated by noise | Noise dominated (total time) | Noise dominated (detector-on time) | Marked lightcurve |
|---|---|---|---|---|---|---|---|
| A | 76411 | 64701 | 236 | 236 | 0.31% | 0.36% | 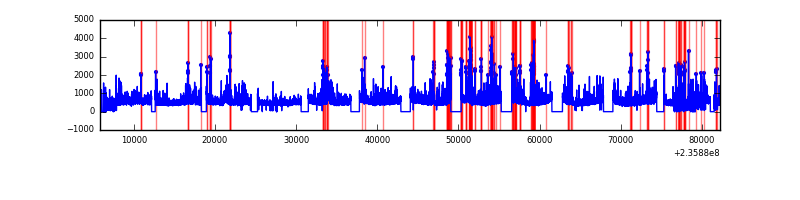 |
| B | 76412 | 64714 | 23 | 23 | 0.03% | 0.04% |  |
| C | 76412 | 64707 | 48 | 48 | 0.06% | 0.07% |  |
| D | 76412 | 64690 | 7774 | 7774 | 10.17% | 12.02% |  |
Top three noisy pixels from each quadrant. If the there are fewer than three noisy pixels in the level2.evt file, extra rows are filled as -1
| Pixel properties | Quadrant properties | ||||||
|---|---|---|---|---|---|---|---|
| Quadrant | DetID | PixID | Counts | Sigma | Mean | Median | Sigma |
| A | 8 | 5 | 6816535 | 4542.75 | 7499 | 7339 | 1498.9 |
| A | 14 | 111 | 486802 | 319.87 | 7499 | 7339 | 1498.9 |
| A | 5 | 16 | 447261 | 293.49 | 7499 | 7339 | 1498.9 |
| B | 0 | 214 | 398410 | 277.62 | 7574 | 7401 | 1408.4 |
| B | 0 | 187 | 232829 | 160.06 | 7574 | 7401 | 1408.4 |
| B | 0 | 219 | 183855 | 125.29 | 7574 | 7401 | 1408.4 |
| C | 4 | 254 | 266161 | 153.15 | 7416 | 7453 | 1689.2 |
| C | 14 | 234 | 142430 | 79.9 | 7416 | 7453 | 1689.2 |
| C | 13 | 61 | 55381 | 28.37 | 7416 | 7453 | 1689.2 |
| D | 1 | 52 | 22286585 | 13055.07 | 6908 | 6750 | 1706.6 |
| D | 12 | 233 | 839998 | 488.25 | 6908 | 6750 | 1706.6 |
| D | 7 | 71 | 578176 | 334.83 | 6908 | 6750 | 1706.6 |
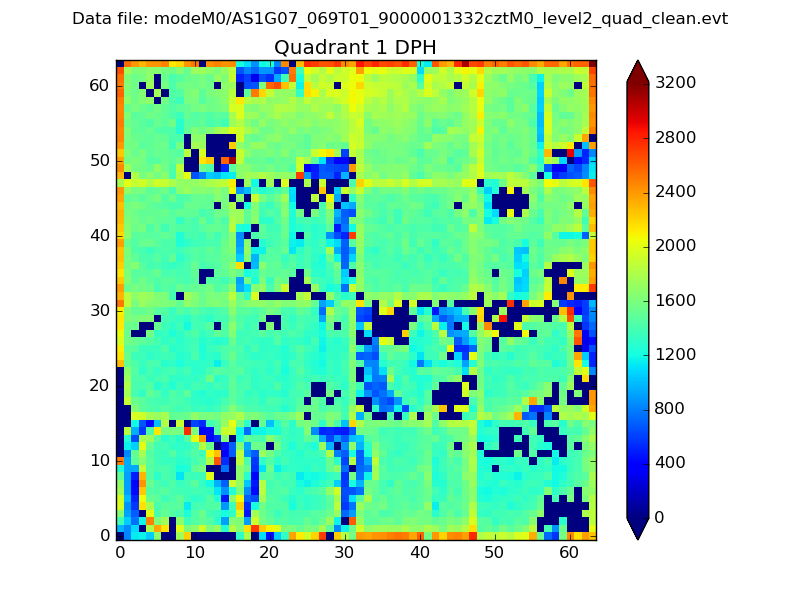
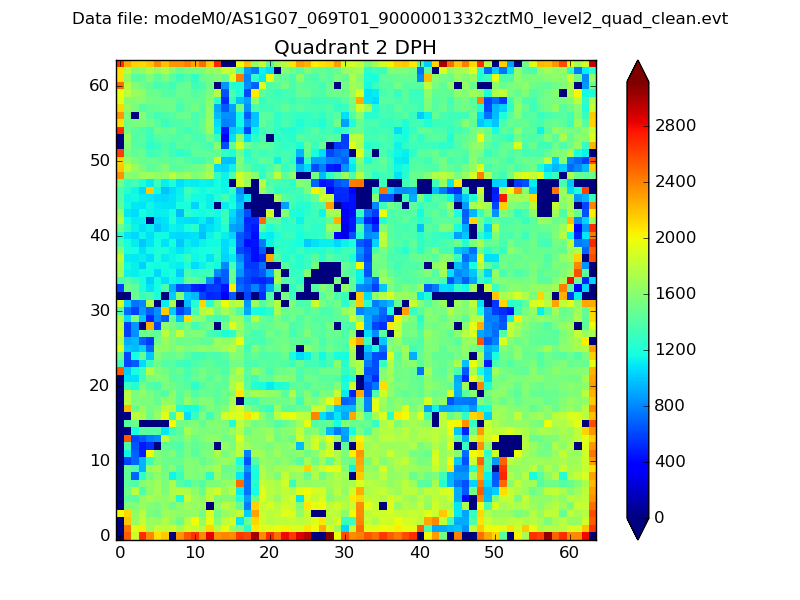
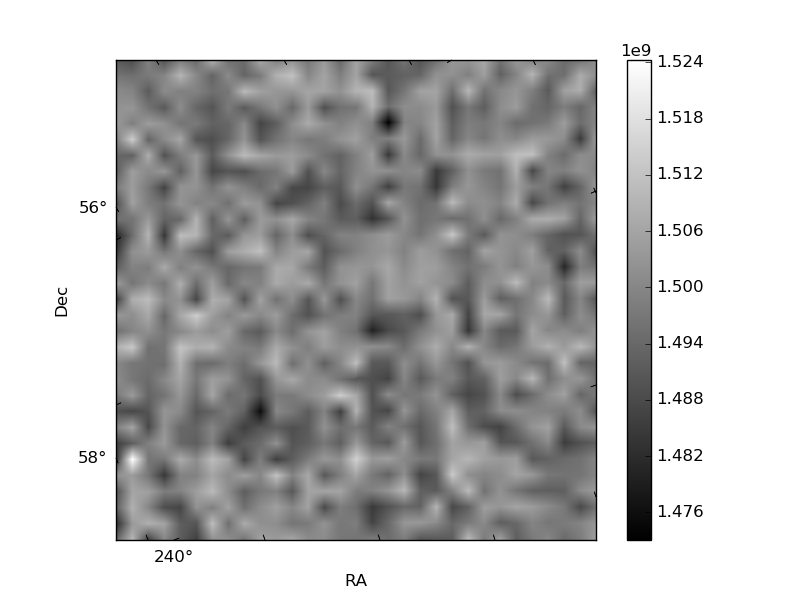
Histogram calculated using DETX and DETY for each event in the final _common_clean file
| Quadrant A |  |
 |
Quadrant B |
|---|---|---|---|
| Quadrant D | 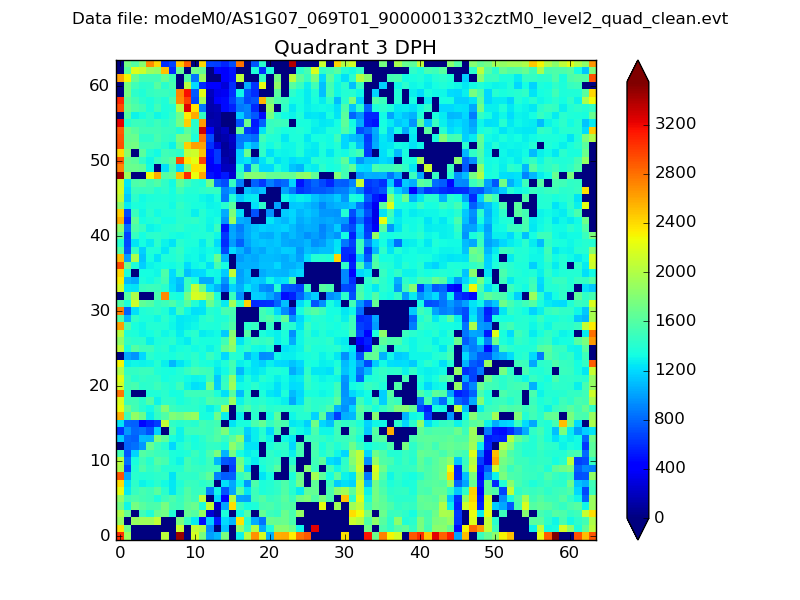 |
 |
Quadrant C |
| Plot type | Count rate plots | Images |
|---|---|---|
| Comparison with Poisson distribution Blue bars denote a histogram of data divided into 1 sec bins. Red curve is a Poisson curve with rate = median count rate of data. |
 |
 |
| Quadrant-wise count rates Data is divided into 100 sec bins |
 |
|
| Module-wise count rates for Quadrant A Data is divided into 100 sec bins |
 |
 |
| Module-wise count rates for Quadrant B Data is divided into 100 sec bins |
 |
 |
| Module-wise count rates for Quadrant C Data is divided into 100 sec bins |
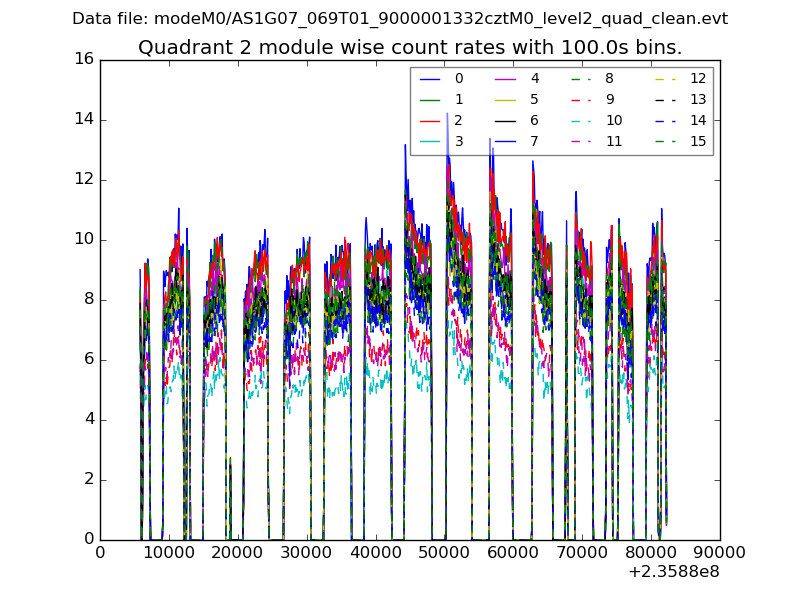 |
 |
| Module-wise count rates for Quadrant D Data is divided into 100 sec bins |
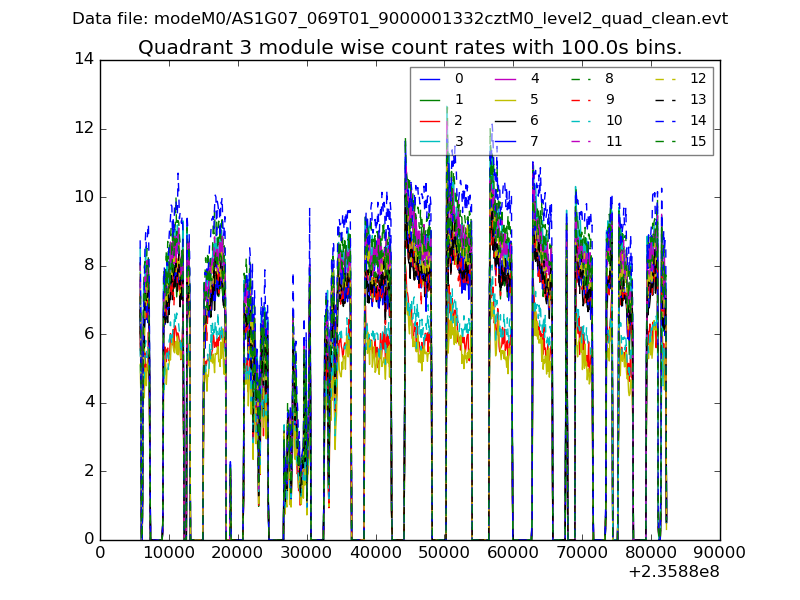 |
 |
| Parameter | Plot |
|---|---|
| CZT HV Monitor |  |
| D_VDD |  |
| Temperature 1 |  |
| Veto HV Monitor |  |
| Veto LLD |  |
| Alpha Counter |  |
| _CPM_Rate | 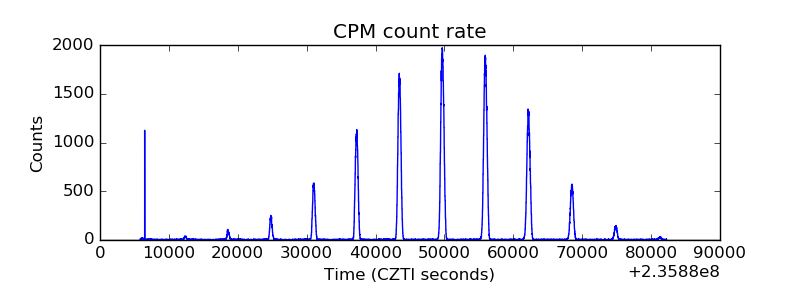 |
| CZT Counter |  |
| +2.5 Volts monitor |  |
| +5 Volts monitor |  |
| _ROLL_ROT |  |
| _Roll_DEC |  |
| _Roll_RA | 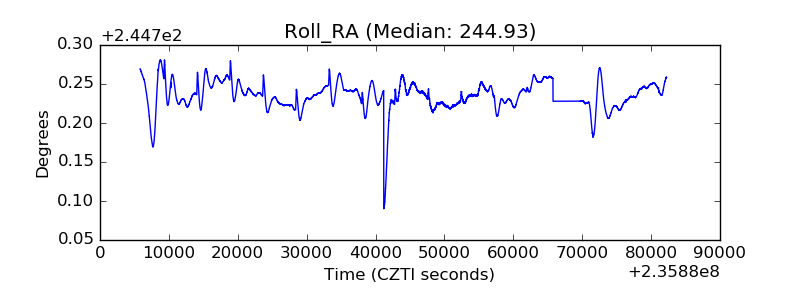 |
| Veto Counter |  |