| Param | Original file | Final file |
|---|---|---|
| Filename | modeM0/AS1A03_057T01_9000001330cztM0_level2.evt | modeM0/AS1A03_057T01_9000001330cztM0_level2_quad_clean.evt |
| Size (bytes) | 3,591,129,600 | 728,893,440 |
| Size | 3.3 GB | 695.1 MB |
| Events in quadrant A | 29,692,754 | 4,723,480 |
| Events in quadrant B | 24,403,522 | 4,782,826 |
| Events in quadrant C | 22,418,789 | 4,649,207 |
| Events in quadrant D | 28,853,236 | 4,475,327 |
| Mode SS | |||
|---|---|---|---|
| Quadrant | BADHDUFLAG | Total packets | Discarded packets |
| A | 0 | 1028 | 0 |
| B | 0 | 1024 | 0 |
| C | 0 | 1026 | 0 |
| D | 0 | 1023 | 0 |
| Mode M0 | |||
|---|---|---|---|
| Quadrant | BADHDUFLAG | Total packets | Discarded packets |
| A | 0 | 121979 | 0 |
| B | 0 | 106455 | 0 |
| C | 0 | 102840 | 0 |
| D | 0 | 120251 | 0 |
| Mode M9 | |||
|---|---|---|---|
| Quadrant | BADHDUFLAG | Total packets | Discarded packets |
| A | 0 | 100 | 0 |
| B | 0 | 100 | 0 |
| C | 0 | 100 | 0 |
| D | 0 | 100 | 0 |
| Quadrant | Total seconds | Saturated seconds | Saturation percentage |
|---|---|---|---|
| A | 50126 | 709 | 1.414436% |
| B | 50300 | 490 | 0.974155% |
| C | 50329 | 242 | 0.480836% |
| D | 50179 | 1005 | 2.002830% |
Noise dominated data is calculated using 1-second bins in cleaned event files. If a bin has >2000 counts, and if more than 50% of those come from <1% of pixels, then it is considered to be noise-dominated and hence unusable.
| Quadrant | # 1 sec bins | Bins with >0 counts | Bins with >2000 counts | High rate bins dominated by noise | Noise dominated (total time) | Noise dominated (detector-on time) | Marked lightcurve |
|---|---|---|---|---|---|---|---|
| A | 62639 | 50867 | 125 | 125 | 0.20% | 0.25% |  |
| B | 62639 | 51002 | 22 | 22 | 0.04% | 0.04% |  |
| C | 62639 | 51056 | 1 | 1 | 0.00% | 0.00% |  |
| D | 62639 | 50913 | 563 | 563 | 0.90% | 1.11% | 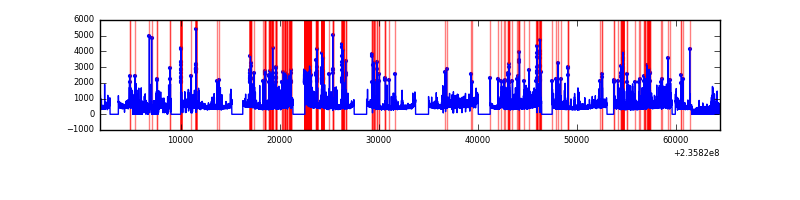 |
Top three noisy pixels from each quadrant. If the there are fewer than three noisy pixels in the level2.evt file, extra rows are filled as -1
| Pixel properties | Quadrant properties | ||||||
|---|---|---|---|---|---|---|---|
| Quadrant | DetID | PixID | Counts | Sigma | Mean | Median | Sigma |
| A | 8 | 5 | 5372856 | 4539.5 | 5896 | 5773 | 1182.3 |
| A | 1 | 162 | 544577 | 455.72 | 5896 | 5773 | 1182.3 |
| A | 13 | 251 | 241729 | 199.57 | 5896 | 5773 | 1182.3 |
| B | 0 | 214 | 435069 | 386.4 | 5966 | 5824 | 1110.9 |
| B | 0 | 219 | 292033 | 257.64 | 5966 | 5824 | 1110.9 |
| B | 4 | 173 | 157905 | 136.9 | 5966 | 5824 | 1110.9 |
| C | 13 | 61 | 43413 | 28.74 | 5722 | 5738 | 1310.7 |
| C | 10 | 22 | 35359 | 22.6 | 5722 | 5738 | 1310.7 |
| C | 8 | 128 | 22301 | 12.64 | 5722 | 5738 | 1310.7 |
| D | 1 | 52 | 3938492 | 2691.82 | 5637 | 5499 | 1461.1 |
| D | 12 | 233 | 1100234 | 749.26 | 5637 | 5499 | 1461.1 |
| D | 8 | 195 | 1050049 | 714.91 | 5637 | 5499 | 1461.1 |
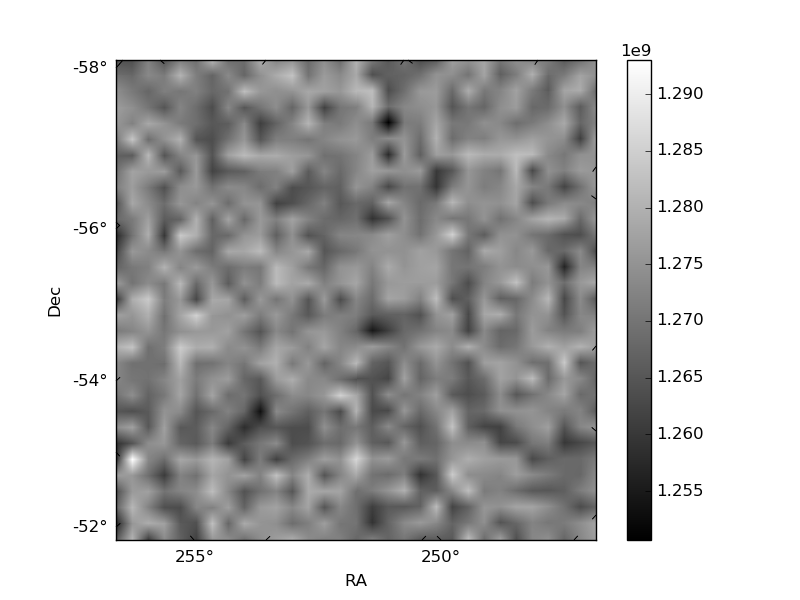
Histogram calculated using DETX and DETY for each event in the final _common_clean file
| Quadrant A |  |
 |
Quadrant B |
|---|---|---|---|
| Quadrant D |  |
 |
Quadrant C |
| Plot type | Count rate plots | Images |
|---|---|---|
| Comparison with Poisson distribution Blue bars denote a histogram of data divided into 1 sec bins. Red curve is a Poisson curve with rate = median count rate of data. |
 |
 |
| Quadrant-wise count rates Data is divided into 100 sec bins |
 |
|
| Module-wise count rates for Quadrant A Data is divided into 100 sec bins |
 |
 |
| Module-wise count rates for Quadrant B Data is divided into 100 sec bins |
 |
 |
| Module-wise count rates for Quadrant C Data is divided into 100 sec bins |
 |
 |
| Module-wise count rates for Quadrant D Data is divided into 100 sec bins |
 |
 |
| Parameter | Plot |
|---|---|
| CZT HV Monitor |  |
| D_VDD |  |
| Temperature 1 |  |
| Veto HV Monitor |  |
| Veto LLD |  |
| Alpha Counter |  |
| _CPM_Rate | 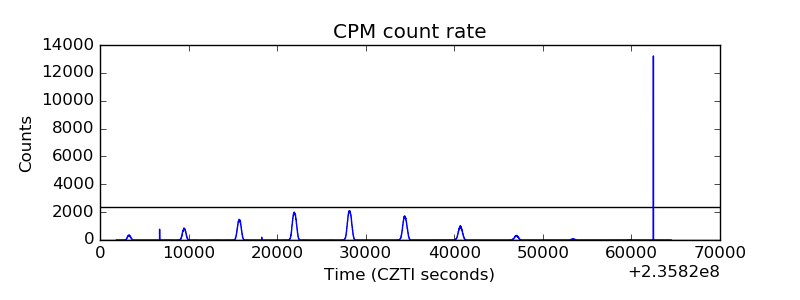 |
| CZT Counter |  |
| +2.5 Volts monitor | 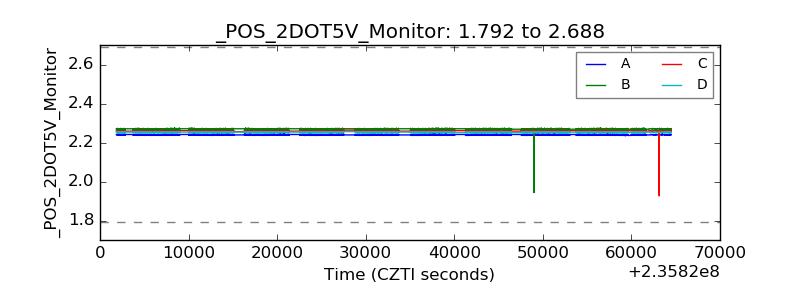 |
| +5 Volts monitor |  |
| _ROLL_ROT |  |
| _Roll_DEC |  |
| _Roll_RA |  |
| Veto Counter |  |