| Param | Original file | Final file |
|---|---|---|
| Filename | modeM0/AS1A03_009T01_9000001328cztM0_level2.evt | modeM0/AS1A03_009T01_9000001328cztM0_level2_quad_clean.evt |
| Size (bytes) | 1,545,658,560 | 252,671,040 |
| Size | 1.4 GB | 241.0 MB |
| Events in quadrant A | 12,355,876 | 1,573,288 |
| Events in quadrant B | 9,609,410 | 1,596,628 |
| Events in quadrant C | 10,546,935 | 1,584,090 |
| Events in quadrant D | 12,943,990 | 1,516,284 |
| Mode M9 | |||
|---|---|---|---|
| Quadrant | BADHDUFLAG | Total packets | Discarded packets |
| A | 0 | 16 | 0 |
| B | 0 | 16 | 0 |
| C | 0 | 15 | 0 |
| D | 0 | 16 | 0 |
| Mode SS | |||
|---|---|---|---|
| Quadrant | BADHDUFLAG | Total packets | Discarded packets |
| A | 0 | 406 | 0 |
| B | 0 | 408 | 0 |
| C | 0 | 408 | 0 |
| D | 0 | 408 | 0 |
| Mode M0 | |||
|---|---|---|---|
| Quadrant | BADHDUFLAG | Total packets | Discarded packets |
| A | 0 | 50047 | 0 |
| B | 0 | 42003 | 0 |
| C | 0 | 46087 | 0 |
| D | 0 | 52055 | 0 |
| Quadrant | Total seconds | Saturated seconds | Saturation percentage |
|---|---|---|---|
| A | 20065 | 312 | 1.554946% |
| B | 20089 | 314 | 1.563044% |
| C | 20077 | 280 | 1.394631% |
| D | 20062 | 613 | 3.055528% |
Noise dominated data is calculated using 1-second bins in cleaned event files. If a bin has >2000 counts, and if more than 50% of those come from <1% of pixels, then it is considered to be noise-dominated and hence unusable.
| Quadrant | # 1 sec bins | Bins with >0 counts | Bins with >2000 counts | High rate bins dominated by noise | Noise dominated (total time) | Noise dominated (detector-on time) | Marked lightcurve |
|---|---|---|---|---|---|---|---|
| A | 21668 | 20150 | 23 | 23 | 0.11% | 0.11% |  |
| B | 21668 | 20151 | 46 | 46 | 0.21% | 0.23% |  |
| C | 21668 | 20149 | 2 | 2 | 0.01% | 0.01% |  |
| D | 21668 | 20152 | 345 | 345 | 1.59% | 1.71% |  |
Top three noisy pixels from each quadrant. If the there are fewer than three noisy pixels in the level2.evt file, extra rows are filled as -1
| Pixel properties | Quadrant properties | ||||||
|---|---|---|---|---|---|---|---|
| Quadrant | DetID | PixID | Counts | Sigma | Mean | Median | Sigma |
| A | 8 | 5 | 3018511 | 6451.85 | 2298 | 2249 | 467.5 |
| A | 1 | 162 | 202382 | 428.09 | 2298 | 2249 | 467.5 |
| A | 1 | 178 | 61440 | 126.61 | 2298 | 2249 | 467.5 |
| B | 0 | 214 | 193911 | 434.38 | 2313 | 2253 | 441.2 |
| B | 5 | 255 | 164485 | 367.69 | 2313 | 2253 | 441.2 |
| B | 0 | 219 | 70969 | 155.74 | 2313 | 2253 | 441.2 |
| C | 9 | 68 | 1811828 | 3501.63 | 2232 | 2238 | 516.8 |
| C | 13 | 61 | 16946 | 28.46 | 2232 | 2238 | 516.8 |
| C | 10 | 22 | 16485 | 27.57 | 2232 | 2238 | 516.8 |
| D | 8 | 195 | 2176091 | 3903.06 | 2195 | 2133 | 557.0 |
| D | 1 | 52 | 1300178 | 2330.47 | 2195 | 2133 | 557.0 |
| D | 7 | 71 | 371258 | 662.72 | 2195 | 2133 | 557.0 |
Histogram calculated using DETX and DETY for each event in the final _common_clean file
| Quadrant A |  |
 |
Quadrant B |
|---|---|---|---|
| Quadrant D |  |
 |
Quadrant C |
| Plot type | Count rate plots | Images |
|---|---|---|
| Comparison with Poisson distribution Blue bars denote a histogram of data divided into 1 sec bins. Red curve is a Poisson curve with rate = median count rate of data. |
 |
 |
| Quadrant-wise count rates Data is divided into 100 sec bins |
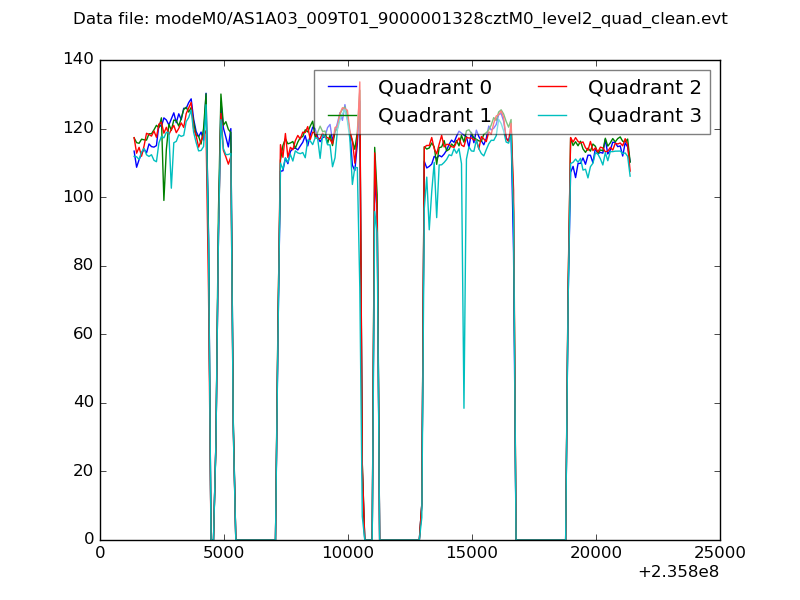 |
|
| Module-wise count rates for Quadrant A Data is divided into 100 sec bins |
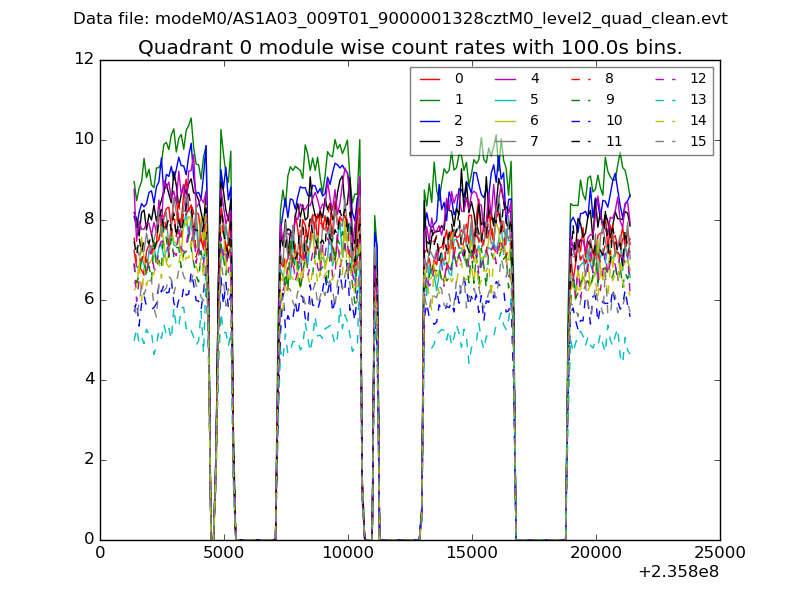 |
 |
| Module-wise count rates for Quadrant B Data is divided into 100 sec bins |
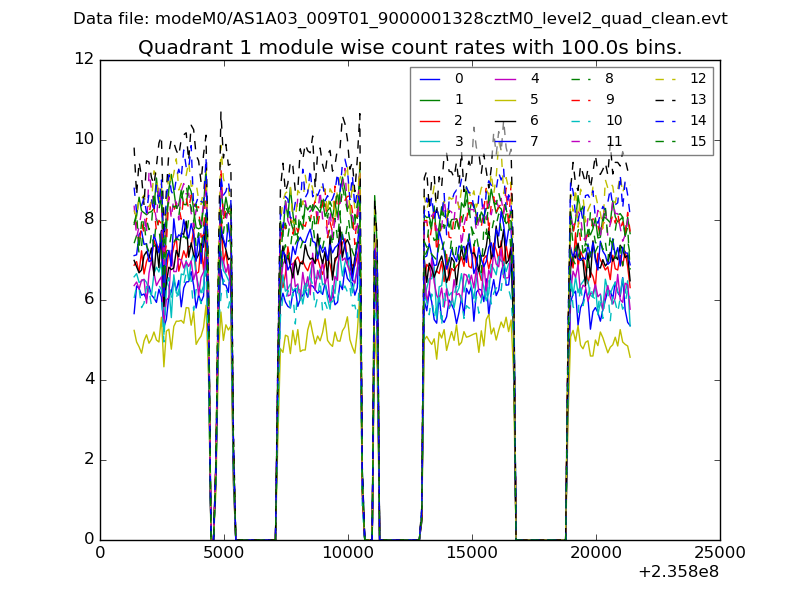 |
 |
| Module-wise count rates for Quadrant C Data is divided into 100 sec bins |
 |
 |
| Module-wise count rates for Quadrant D Data is divided into 100 sec bins |
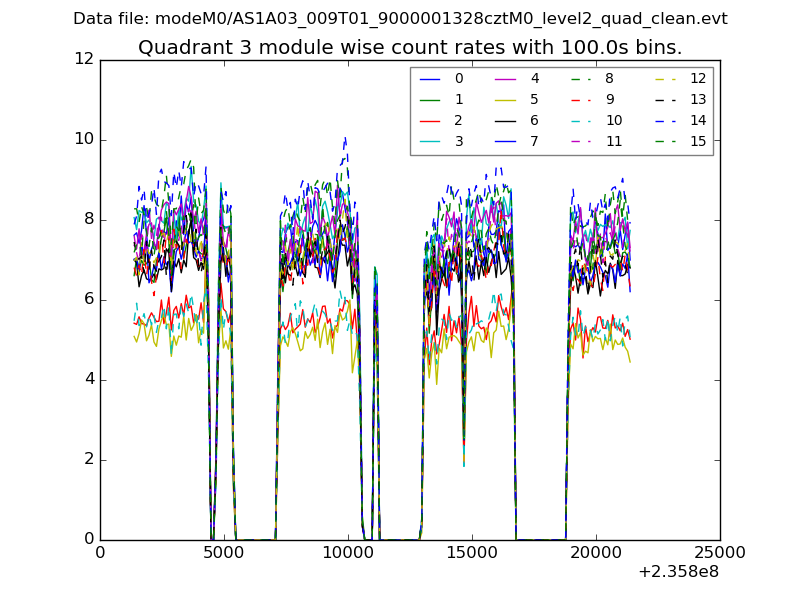 |
 |
| Parameter | Plot |
|---|---|
| CZT HV Monitor |  |
| D_VDD |  |
| Temperature 1 |  |
| Veto HV Monitor |  |
| Veto LLD |  |
| Alpha Counter | 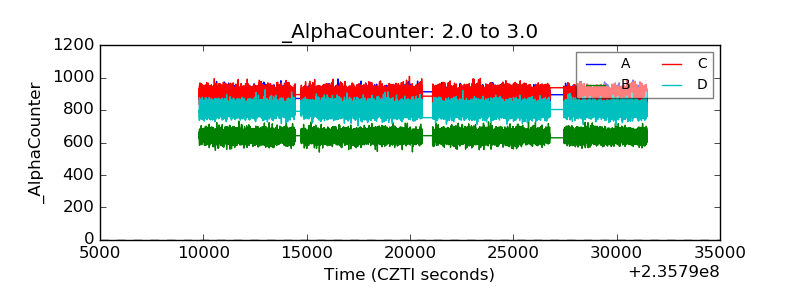 |
| _CPM_Rate |  |
| CZT Counter | 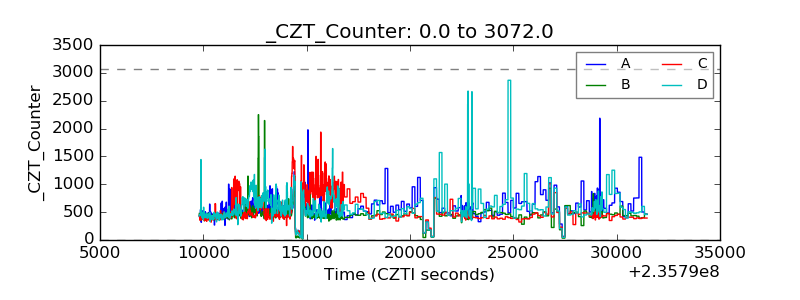 |
| +2.5 Volts monitor | 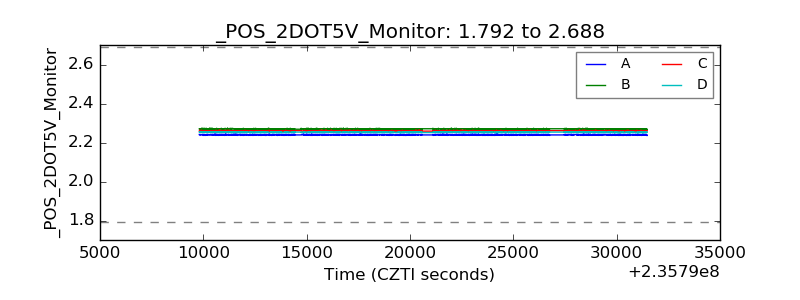 |
| +5 Volts monitor |  |
| _ROLL_ROT |  |
| _Roll_DEC |  |
| _Roll_RA |  |
| Veto Counter |  |