| Param | Original file | Final file |
|---|---|---|
| Filename | modeM0/AS1A03_069T02_9000001324cztM0_level2.evt | modeM0/AS1A03_069T02_9000001324cztM0_level2_quad_clean.evt |
| Size (bytes) | 604,843,200 | 130,512,960 |
| Size | 576.8 MB | 124.5 MB |
| Events in quadrant A | 4,617,023 | 849,034 |
| Events in quadrant B | 4,081,255 | 856,414 |
| Events in quadrant C | 3,759,145 | 858,528 |
| Events in quadrant D | 5,294,123 | 809,383 |
| Mode SS | |||
|---|---|---|---|
| Quadrant | BADHDUFLAG | Total packets | Discarded packets |
| A | 0 | 172 | 0 |
| B | 0 | 176 | 0 |
| C | 0 | 172 | 0 |
| D | 0 | 172 | 0 |
| Mode M0 | |||
|---|---|---|---|
| Quadrant | BADHDUFLAG | Total packets | Discarded packets |
| A | 0 | 19178 | 0 |
| B | 0 | 17758 | 0 |
| C | 0 | 17043 | 0 |
| D | 0 | 21405 | 0 |
| Mode M9 | |||
|---|---|---|---|
| Quadrant | BADHDUFLAG | Total packets | Discarded packets |
| A | 0 | 19 | 0 |
| B | 0 | 19 | 0 |
| C | 0 | 19 | 0 |
| D | 0 | 18 | 0 |
| Quadrant | Total seconds | Saturated seconds | Saturation percentage |
|---|---|---|---|
| A | 8317 | 148 | 1.779488% |
| B | 8327 | 121 | 1.453104% |
| C | 8353 | 87 | 1.041542% |
| D | 8343 | 348 | 4.171161% |
Noise dominated data is calculated using 1-second bins in cleaned event files. If a bin has >2000 counts, and if more than 50% of those come from <1% of pixels, then it is considered to be noise-dominated and hence unusable.
| Quadrant | # 1 sec bins | Bins with >0 counts | Bins with >2000 counts | High rate bins dominated by noise | Noise dominated (total time) | Noise dominated (detector-on time) | Marked lightcurve |
|---|---|---|---|---|---|---|---|
| A | 10791 | 8544 | 10 | 10 | 0.09% | 0.12% |  |
| B | 10791 | 8556 | 7 | 7 | 0.06% | 0.08% | 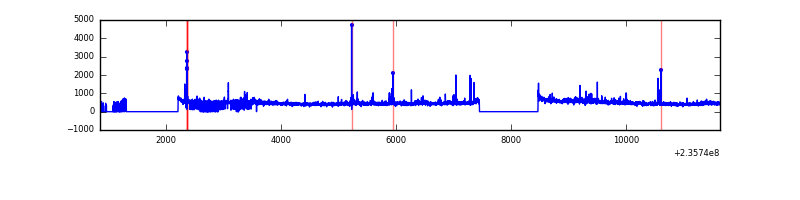 |
| C | 10787 | 8567 | 0 | 0 | 0.00% | 0.00% |  |
| D | 10780 | 8539 | 214 | 214 | 1.99% | 2.51% |  |
Top three noisy pixels from each quadrant. If the there are fewer than three noisy pixels in the level2.evt file, extra rows are filled as -1
| Pixel properties | Quadrant properties | ||||||
|---|---|---|---|---|---|---|---|
| Quadrant | DetID | PixID | Counts | Sigma | Mean | Median | Sigma |
| A | 8 | 5 | 737986 | 3704.81 | 968 | 945 | 198.9 |
| A | 13 | 251 | 75943 | 376.99 | 968 | 945 | 198.9 |
| A | 1 | 162 | 31221 | 152.19 | 968 | 945 | 198.9 |
| B | 0 | 214 | 89551 | 481.07 | 970 | 945 | 184.2 |
| B | 0 | 219 | 64816 | 346.78 | 970 | 945 | 184.2 |
| B | 5 | 255 | 60783 | 324.88 | 970 | 945 | 184.2 |
| C | 8 | 222 | 7678 | 30.57 | 959 | 963 | 219.6 |
| C | 13 | 61 | 7346 | 29.06 | 959 | 963 | 219.6 |
| C | 14 | 67 | 4412 | 15.7 | 959 | 963 | 219.6 |
| D | 1 | 52 | 635660 | 2560.41 | 934 | 912 | 247.9 |
| D | 12 | 227 | 300688 | 1209.22 | 934 | 912 | 247.9 |
| D | 1 | 255 | 205904 | 826.89 | 934 | 912 | 247.9 |
Histogram calculated using DETX and DETY for each event in the final _common_clean file
| Quadrant A |  |
 |
Quadrant B |
|---|---|---|---|
| Quadrant D |  |
 |
Quadrant C |
| Plot type | Count rate plots | Images |
|---|---|---|
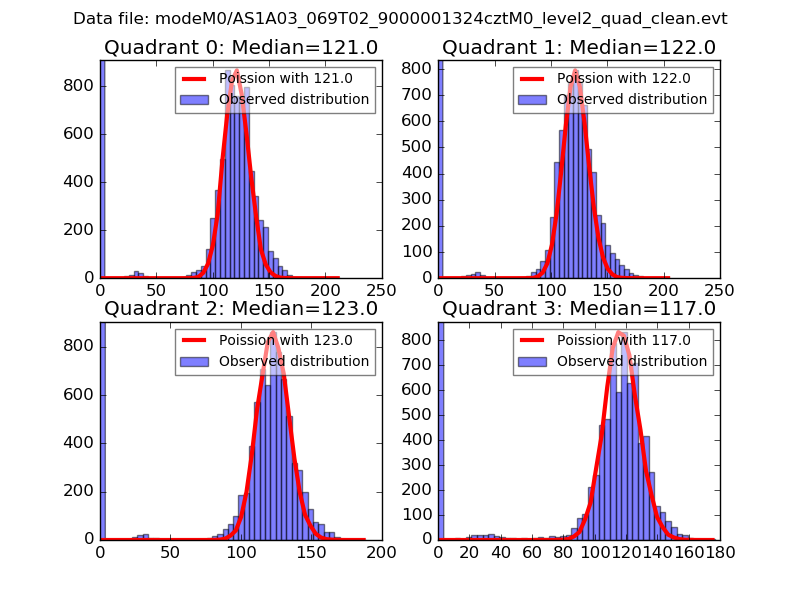
| Comparison with Poisson distribution Blue bars denote a histogram of data divided into 1 sec bins. Red curve is a Poisson curve with rate = median count rate of data. |
 |
 |
| Quadrant-wise count rates Data is divided into 100 sec bins |
 |
|
| Module-wise count rates for Quadrant A Data is divided into 100 sec bins |
 |
 |
| Module-wise count rates for Quadrant B Data is divided into 100 sec bins |
 |
 |
| Module-wise count rates for Quadrant C Data is divided into 100 sec bins |
 |
 |
| Module-wise count rates for Quadrant D Data is divided into 100 sec bins |
 |
 |
| Parameter | Plot |
|---|---|
| CZT HV Monitor |  |
| D_VDD |  |
| Temperature 1 |  |
| Veto HV Monitor |  |
| Veto LLD |  |
| Alpha Counter | 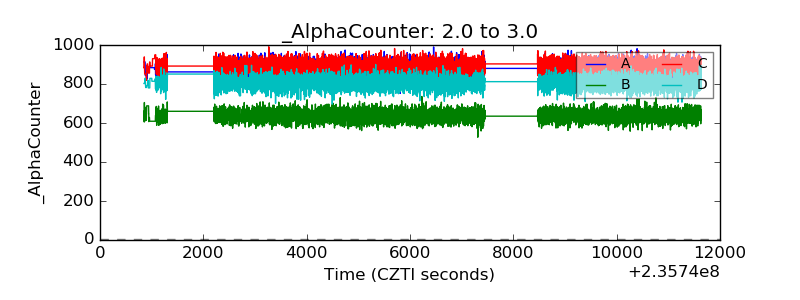 |
| _CPM_Rate |  |
| CZT Counter | 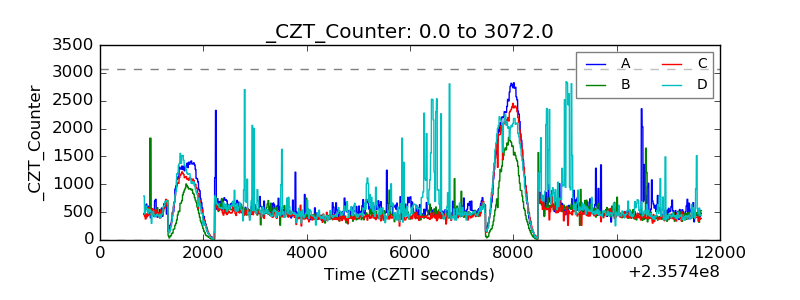 |
| +2.5 Volts monitor |  |
| +5 Volts monitor |  |
| _ROLL_ROT |  |
| _Roll_DEC |  |
| _Roll_RA |  |
| Veto Counter |  |