| Param | Original file | Final file |
|---|---|---|
| Filename | modeM0/AS1G07_076T02_9000001320cztM0_level2.evt | modeM0/AS1G07_076T02_9000001320cztM0_level2_quad_clean.evt |
| Size (bytes) | 1,114,905,600 | 169,338,240 |
| Size | 1.0 GB | 161.5 MB |
| Events in quadrant A | 8,597,701 | 1,114,195 |
| Events in quadrant B | 6,370,463 | 1,130,887 |
| Events in quadrant C | 6,816,805 | 1,086,140 |
| Events in quadrant D | 11,118,776 | 915,770 |
| Mode M9 | |||
|---|---|---|---|
| Quadrant | BADHDUFLAG | Total packets | Discarded packets |
| A | 0 | 27 | 0 |
| B | 0 | 27 | 0 |
| C | 0 | 25 | 0 |
| D | 0 | 25 | 0 |
| Mode SS | |||
|---|---|---|---|
| Quadrant | BADHDUFLAG | Total packets | Discarded packets |
| A | 0 | 269 | 0 |
| B | 0 | 262 | 0 |
| C | 0 | 262 | 0 |
| D | 0 | 262 | 0 |
| Mode M0 | |||
|---|---|---|---|
| Quadrant | BADHDUFLAG | Total packets | Discarded packets |
| A | 0 | 34283 | 0 |
| B | 0 | 27301 | 0 |
| C | 0 | 29009 | 0 |
| D | 0 | 41873 | 0 |
| Quadrant | Total seconds | Saturated seconds | Saturation percentage |
|---|---|---|---|
| A | 12689 | 287 | 2.261802% |
| B | 12745 | 163 | 1.278933% |
| C | 12766 | 286 | 2.240326% |
| D | 12719 | 2142 | 16.840947% |
Noise dominated data is calculated using 1-second bins in cleaned event files. If a bin has >2000 counts, and if more than 50% of those come from <1% of pixels, then it is considered to be noise-dominated and hence unusable.
| Quadrant | # 1 sec bins | Bins with >0 counts | Bins with >2000 counts | High rate bins dominated by noise | Noise dominated (total time) | Noise dominated (detector-on time) | Marked lightcurve |
|---|---|---|---|---|---|---|---|
| A | 16434 | 13062 | 47 | 47 | 0.29% | 0.36% |  |
| B | 16434 | 13116 | 9 | 9 | 0.05% | 0.07% | 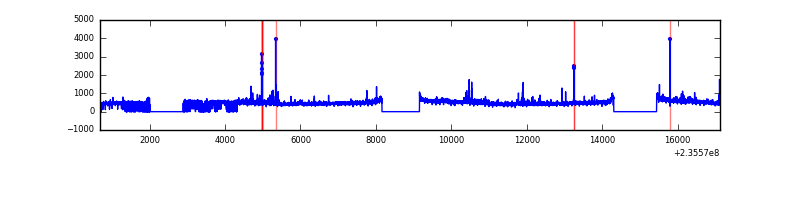 |
| C | 16432 | 13147 | 116 | 116 | 0.71% | 0.88% |  |
| D | 16434 | 13101 | 1844 | 1844 | 11.22% | 14.08% |  |
Top three noisy pixels from each quadrant. If the there are fewer than three noisy pixels in the level2.evt file, extra rows are filled as -1
| Pixel properties | Quadrant properties | ||||||
|---|---|---|---|---|---|---|---|
| Quadrant | DetID | PixID | Counts | Sigma | Mean | Median | Sigma |
| A | 8 | 5 | 2424134 | 7793.81 | 1543 | 1514 | 310.8 |
| A | 1 | 162 | 85095 | 268.89 | 1543 | 1514 | 310.8 |
| A | 15 | 174 | 63511 | 199.45 | 1543 | 1514 | 310.8 |
| B | 0 | 214 | 115443 | 388.85 | 1545 | 1510 | 293.0 |
| B | 10 | 245 | 64311 | 214.34 | 1545 | 1510 | 293.0 |
| B | 0 | 187 | 48729 | 161.16 | 1545 | 1510 | 293.0 |
| C | 4 | 254 | 992205 | 2869.82 | 1484 | 1490 | 345.2 |
| C | 8 | 128 | 12838 | 32.87 | 1484 | 1490 | 345.2 |
| C | 13 | 61 | 11351 | 28.56 | 1484 | 1490 | 345.2 |
| D | 1 | 52 | 4403788 | 13346.01 | 1360 | 1328 | 329.9 |
| D | 7 | 71 | 1041330 | 3152.76 | 1360 | 1328 | 329.9 |
| D | 12 | 233 | 195635 | 589.04 | 1360 | 1328 | 329.9 |
Histogram calculated using DETX and DETY for each event in the final _common_clean file
| Quadrant A | 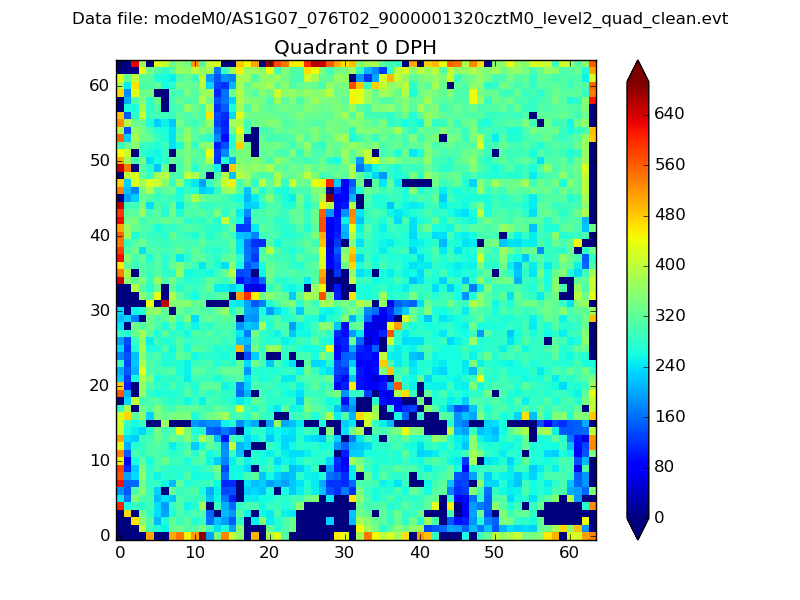 |
 |
Quadrant B |
|---|---|---|---|
| Quadrant D |  |
 |
Quadrant C |
| Plot type | Count rate plots | Images |
|---|---|---|
| Comparison with Poisson distribution Blue bars denote a histogram of data divided into 1 sec bins. Red curve is a Poisson curve with rate = median count rate of data. |
 |
 |
| Quadrant-wise count rates Data is divided into 100 sec bins |
 |
|
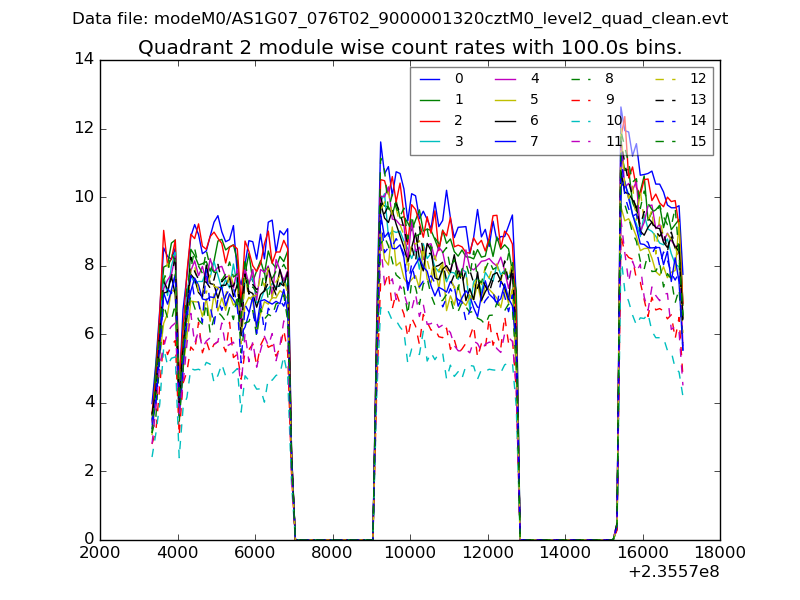
| Module-wise count rates for Quadrant A Data is divided into 100 sec bins |
 |
 |
| Module-wise count rates for Quadrant B Data is divided into 100 sec bins |
 |
 |
| Module-wise count rates for Quadrant C Data is divided into 100 sec bins |
 |
 |
| Module-wise count rates for Quadrant D Data is divided into 100 sec bins |
 |
 |
| Parameter | Plot |
|---|---|
| CZT HV Monitor |  |
| D_VDD |  |
| Temperature 1 |  |
| Veto HV Monitor |  |
| Veto LLD |  |
| Alpha Counter | 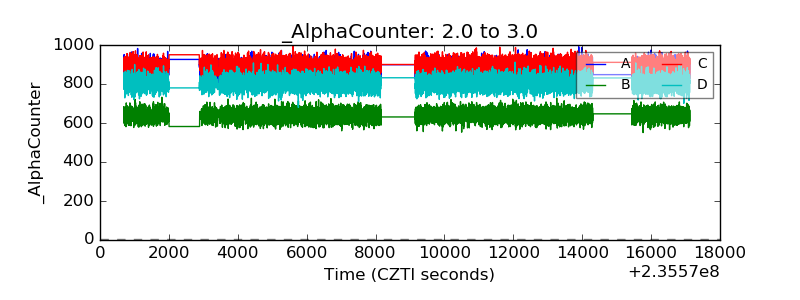 |
| _CPM_Rate |  |
| CZT Counter |  |
| +2.5 Volts monitor |  |
| +5 Volts monitor |  |
| _ROLL_ROT | 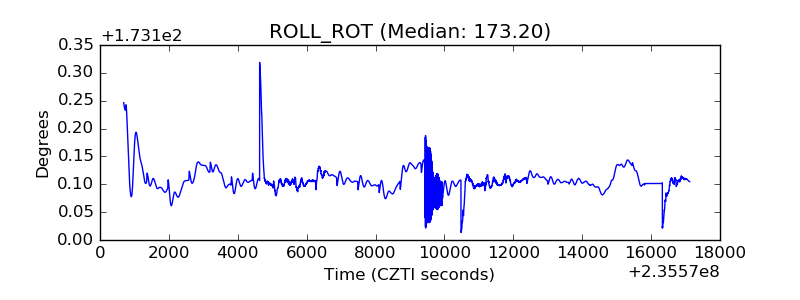 |
| _Roll_DEC | 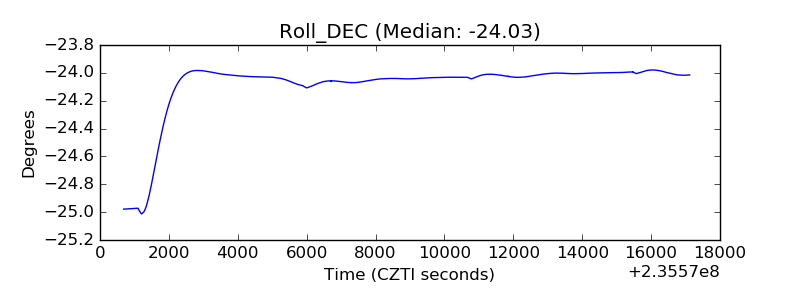 |
| _Roll_RA | 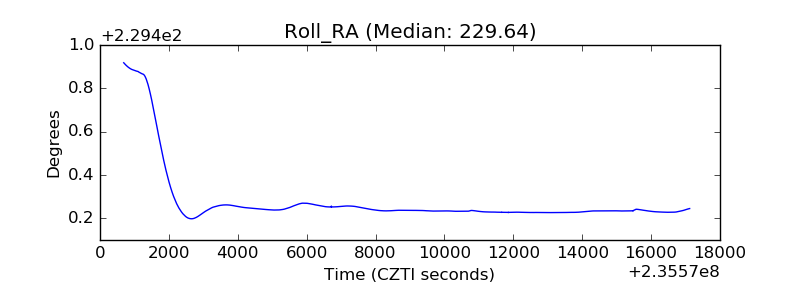 |
| Veto Counter |  |