| Param | Original file | Final file |
|---|---|---|
| Filename | modeM0/AS1G07_002T01_9000001316cztM0_level2.evt | modeM0/AS1G07_002T01_9000001316cztM0_level2_quad_clean.evt |
| Size (bytes) | 2,952,247,680 | 512,784,000 |
| Size | 2.7 GB | 489.0 MB |
| Events in quadrant A | 24,765,056 | 3,210,298 |
| Events in quadrant B | 19,487,951 | 3,275,119 |
| Events in quadrant C | 18,210,990 | 3,239,925 |
| Events in quadrant D | 24,267,634 | 3,081,246 |
| Mode SS | |||
|---|---|---|---|
| Quadrant | BADHDUFLAG | Total packets | Discarded packets |
| A | 0 | 810 | 0 |
| B | 0 | 800 | 0 |
| C | 0 | 808 | 0 |
| D | 0 | 812 | 0 |
| Mode M9 | |||
|---|---|---|---|
| Quadrant | BADHDUFLAG | Total packets | Discarded packets |
| A | 0 | 55 | 0 |
| B | 0 | 54 | 0 |
| C | 0 | 55 | 0 |
| D | 0 | 54 | 0 |
| Mode M0 | |||
|---|---|---|---|
| Quadrant | BADHDUFLAG | Total packets | Discarded packets |
| A | 0 | 99516 | 0 |
| B | 0 | 84188 | 0 |
| C | 0 | 81718 | 0 |
| D | 0 | 99537 | 0 |
| Quadrant | Total seconds | Saturated seconds | Saturation percentage |
|---|---|---|---|
| A | 39583 | 1244 | 3.142763% |
| B | 39704 | 826 | 2.080395% |
| C | 39748 | 541 | 1.361075% |
| D | 39672 | 2074 | 5.227869% |
Noise dominated data is calculated using 1-second bins in cleaned event files. If a bin has >2000 counts, and if more than 50% of those come from <1% of pixels, then it is considered to be noise-dominated and hence unusable.
| Quadrant | # 1 sec bins | Bins with >0 counts | Bins with >2000 counts | High rate bins dominated by noise | Noise dominated (total time) | Noise dominated (detector-on time) | Marked lightcurve |
|---|---|---|---|---|---|---|---|
| A | 45990 | 40133 | 237 | 237 | 0.52% | 0.59% | 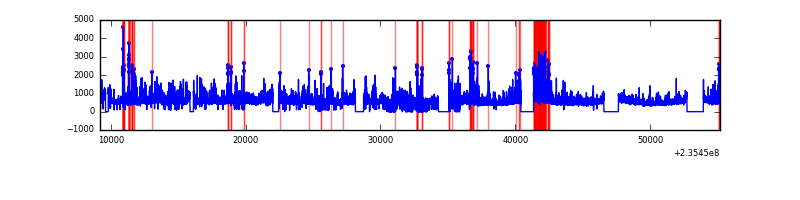 |
| B | 45990 | 40187 | 62 | 62 | 0.13% | 0.15% |  |
| C | 45990 | 40232 | 1 | 1 | 0.00% | 0.00% | 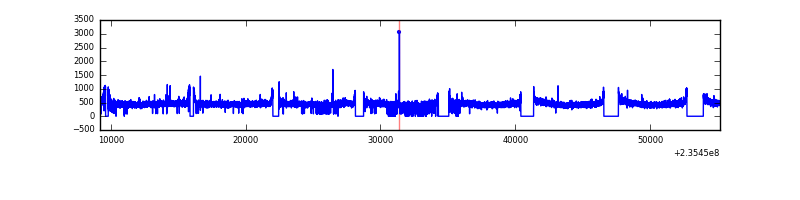 |
| D | 45990 | 40185 | 1140 | 1140 | 2.48% | 2.84% | 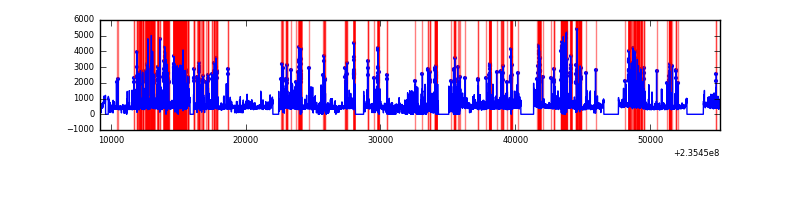 |
Top three noisy pixels from each quadrant. If the there are fewer than three noisy pixels in the level2.evt file, extra rows are filled as -1
| Pixel properties | Quadrant properties | ||||||
|---|---|---|---|---|---|---|---|
| Quadrant | DetID | PixID | Counts | Sigma | Mean | Median | Sigma |
| A | 8 | 5 | 5739705 | 6029.82 | 4720 | 4619 | 951.1 |
| A | 1 | 162 | 334675 | 347.02 | 4720 | 4619 | 951.1 |
| A | 5 | 16 | 151273 | 154.19 | 4720 | 4619 | 951.1 |
| B | 10 | 245 | 598791 | 653.77 | 4763 | 4635 | 908.8 |
| B | 0 | 219 | 179020 | 191.88 | 4763 | 4635 | 908.8 |
| B | 12 | 111 | 105192 | 110.65 | 4763 | 4635 | 908.8 |
| C | 13 | 61 | 34892 | 28.1 | 4653 | 4673 | 1075.3 |
| C | 8 | 222 | 25274 | 19.16 | 4653 | 4673 | 1075.3 |
| C | 9 | 68 | 21972 | 16.09 | 4653 | 4673 | 1075.3 |
| D | 12 | 227 | 3032398 | 2736.34 | 4537 | 4420 | 1106.6 |
| D | 1 | 52 | 2290094 | 2065.53 | 4537 | 4420 | 1106.6 |
| D | 10 | 172 | 967539 | 870.36 | 4537 | 4420 | 1106.6 |
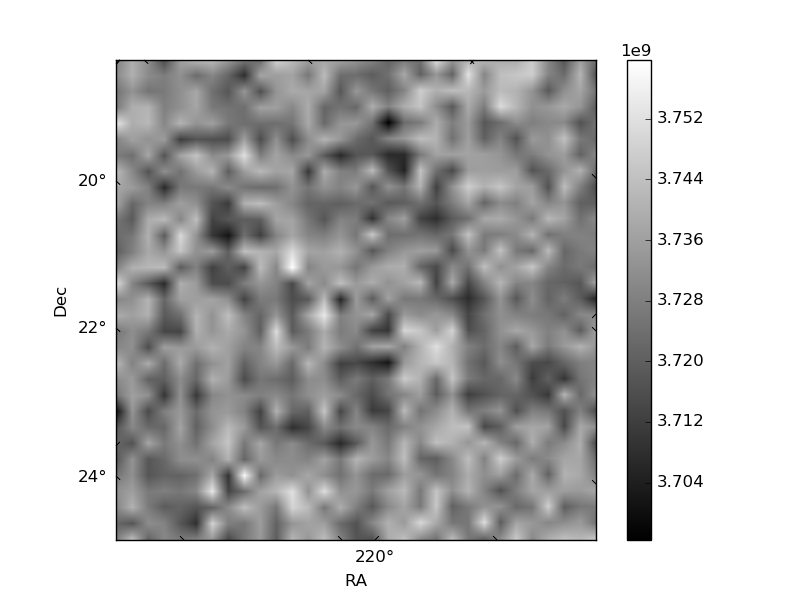
Histogram calculated using DETX and DETY for each event in the final _common_clean file
| Quadrant A |  |
 |
Quadrant B |
|---|---|---|---|
| Quadrant D |  |
 |
Quadrant C |
| Plot type | Count rate plots | Images |
|---|---|---|
| Comparison with Poisson distribution Blue bars denote a histogram of data divided into 1 sec bins. Red curve is a Poisson curve with rate = median count rate of data. |
 |
 |
| Quadrant-wise count rates Data is divided into 100 sec bins |
 |
|
| Module-wise count rates for Quadrant A Data is divided into 100 sec bins |
 |
 |
| Module-wise count rates for Quadrant B Data is divided into 100 sec bins |
 |
 |
| Module-wise count rates for Quadrant C Data is divided into 100 sec bins |
 |
 |
| Module-wise count rates for Quadrant D Data is divided into 100 sec bins |
 |
 |
| Parameter | Plot |
|---|---|
| CZT HV Monitor | 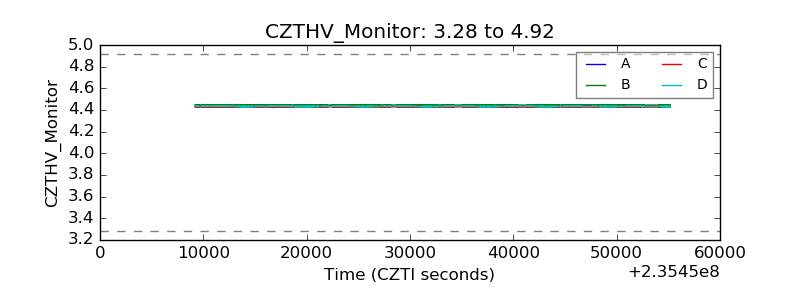 |
| D_VDD |  |
| Temperature 1 |  |
| Veto HV Monitor |  |
| Veto LLD |  |
| Alpha Counter |  |
| _CPM_Rate |  |
| CZT Counter |  |
| +2.5 Volts monitor |  |
| +5 Volts monitor | 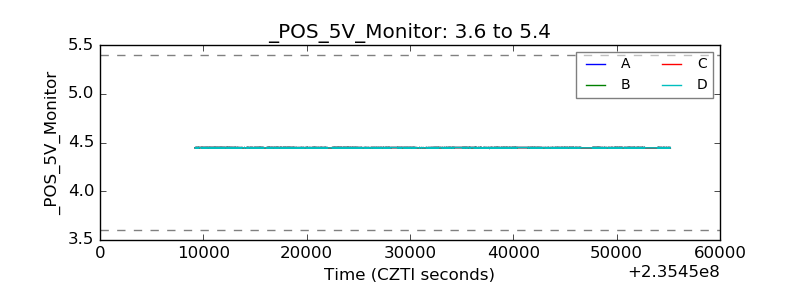 |
| _ROLL_ROT |  |
| _Roll_DEC |  |
| _Roll_RA |  |
| Veto Counter |  |