| Param | Original file | Final file |
|---|---|---|
| Filename | modeM0/AS1G07_077T04_9000001312cztM0_level2.evt | modeM0/AS1G07_077T04_9000001312cztM0_level2_quad_clean.evt |
| Size (bytes) | 1,979,340,480 | 394,842,240 |
| Size | 1.8 GB | 376.6 MB |
| Events in quadrant A | 16,191,749 | 2,482,583 |
| Events in quadrant B | 14,021,642 | 2,519,176 |
| Events in quadrant C | 13,580,569 | 2,513,463 |
| Events in quadrant D | 14,183,767 | 2,443,425 |
| Mode SS | |||
|---|---|---|---|
| Quadrant | BADHDUFLAG | Total packets | Discarded packets |
| A | 0 | 594 | 0 |
| B | 0 | 594 | 0 |
| C | 0 | 594 | 0 |
| D | 0 | 594 | 0 |
| Mode M9 | |||
|---|---|---|---|
| Quadrant | BADHDUFLAG | Total packets | Discarded packets |
| A | 0 | 54 | 0 |
| B | 0 | 54 | 0 |
| C | 0 | 54 | 0 |
| D | 0 | 54 | 0 |
| Mode M0 | |||
|---|---|---|---|
| Quadrant | BADHDUFLAG | Total packets | Discarded packets |
| A | 0 | 67223 | 0 |
| B | 0 | 61321 | 0 |
| C | 0 | 60590 | 0 |
| D | 0 | 63082 | 0 |
| Quadrant | Total seconds | Saturated seconds | Saturation percentage |
|---|---|---|---|
| A | 29119 | 578 | 1.984958% |
| B | 29112 | 352 | 1.209123% |
| C | 29112 | 279 | 0.958368% |
| D | 29109 | 509 | 1.748600% |
Noise dominated data is calculated using 1-second bins in cleaned event files. If a bin has >2000 counts, and if more than 50% of those come from <1% of pixels, then it is considered to be noise-dominated and hence unusable.
| Quadrant | # 1 sec bins | Bins with >0 counts | Bins with >2000 counts | High rate bins dominated by noise | Noise dominated (total time) | Noise dominated (detector-on time) | Marked lightcurve |
|---|---|---|---|---|---|---|---|
| A | 34573 | 29128 | 140 | 140 | 0.40% | 0.48% | 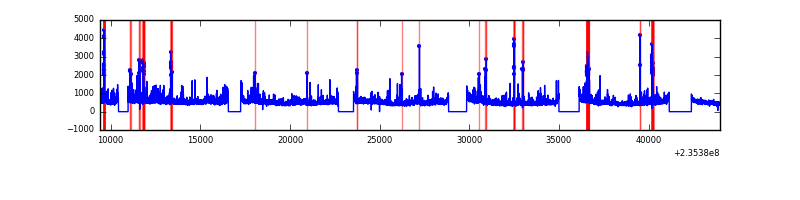 |
| B | 34573 | 29127 | 20 | 20 | 0.06% | 0.07% |  |
| C | 34573 | 29128 | 6 | 6 | 0.02% | 0.02% |  |
| D | 34573 | 29129 | 208 | 208 | 0.60% | 0.71% |  |
Top three noisy pixels from each quadrant. If the there are fewer than three noisy pixels in the level2.evt file, extra rows are filled as -1
| Pixel properties | Quadrant properties | ||||||
|---|---|---|---|---|---|---|---|
| Quadrant | DetID | PixID | Counts | Sigma | Mean | Median | Sigma |
| A | 8 | 5 | 2202550 | 3217.45 | 3401 | 3324 | 683.5 |
| A | 15 | 239 | 254907 | 368.06 | 3401 | 3324 | 683.5 |
| A | 5 | 16 | 201688 | 290.2 | 3401 | 3324 | 683.5 |
| B | 0 | 214 | 253176 | 386.04 | 3436 | 3347 | 647.2 |
| B | 0 | 219 | 208670 | 317.27 | 3436 | 3347 | 647.2 |
| B | 12 | 111 | 72452 | 106.78 | 3436 | 3347 | 647.2 |
| C | 9 | 68 | 381942 | 490.97 | 3364 | 3377 | 771.1 |
| C | 14 | 67 | 67918 | 83.7 | 3364 | 3377 | 771.1 |
| C | 13 | 61 | 25297 | 28.43 | 3364 | 3377 | 771.1 |
| D | 1 | 52 | 690877 | 845.04 | 3316 | 3235 | 813.7 |
| D | 2 | 136 | 309002 | 375.75 | 3316 | 3235 | 813.7 |
| D | 12 | 227 | 188243 | 227.35 | 3316 | 3235 | 813.7 |
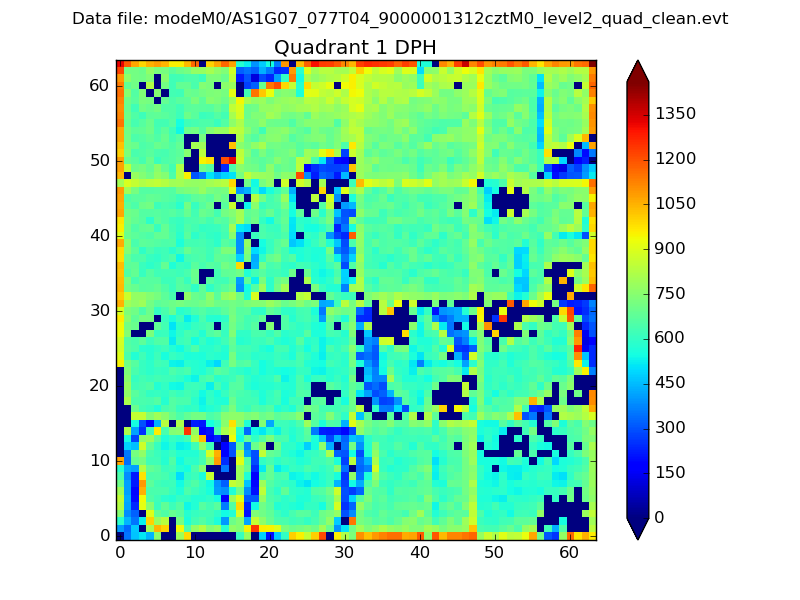
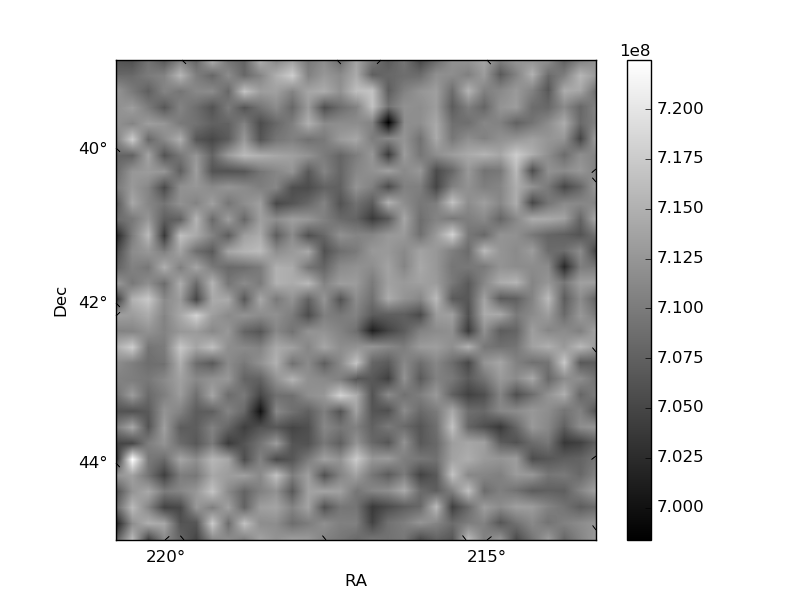
Histogram calculated using DETX and DETY for each event in the final _common_clean file
| Quadrant A |  |
 |
Quadrant B |
|---|---|---|---|
| Quadrant D | 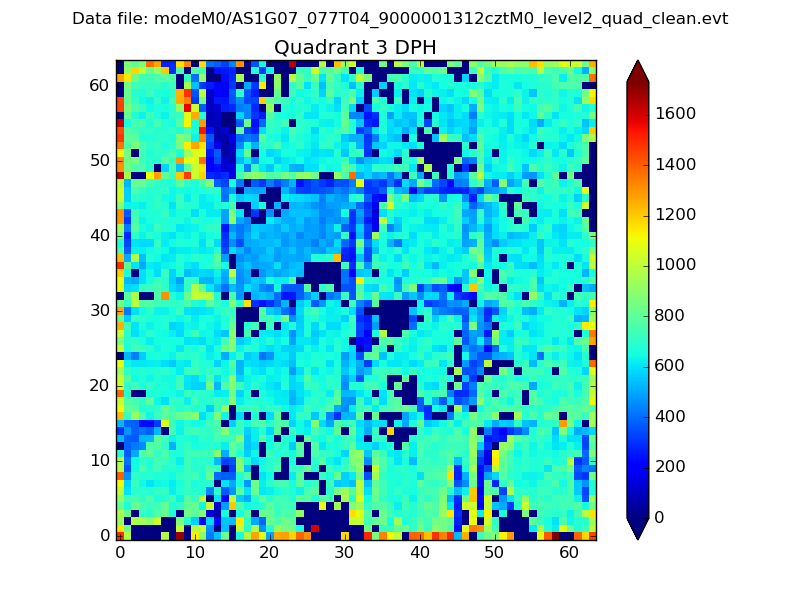 |
 |
Quadrant C |
| Plot type | Count rate plots | Images |
|---|---|---|
| Comparison with Poisson distribution Blue bars denote a histogram of data divided into 1 sec bins. Red curve is a Poisson curve with rate = median count rate of data. |
 |
 |
| Quadrant-wise count rates Data is divided into 100 sec bins |
 |
|
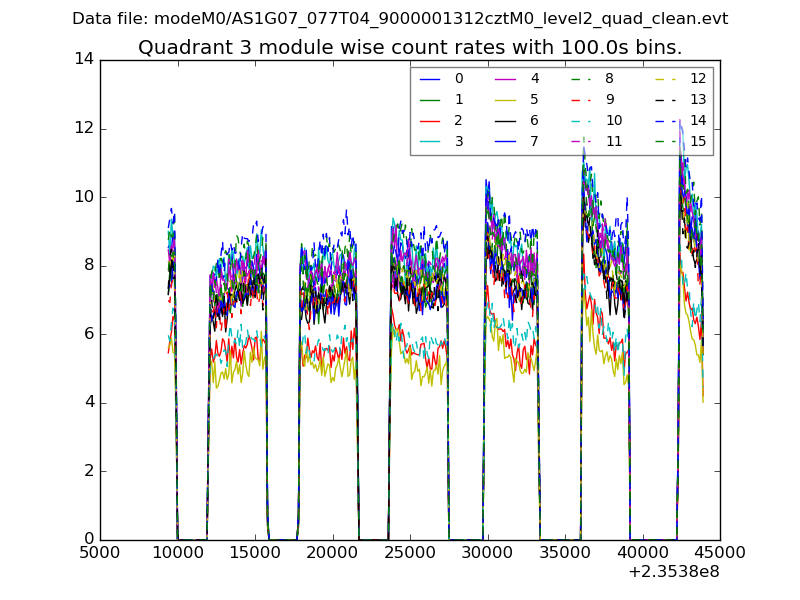
| Module-wise count rates for Quadrant A Data is divided into 100 sec bins |
 |
 |
| Module-wise count rates for Quadrant B Data is divided into 100 sec bins |
 |
 |
| Module-wise count rates for Quadrant C Data is divided into 100 sec bins |
 |
 |
| Module-wise count rates for Quadrant D Data is divided into 100 sec bins |
 |
 |
| Parameter | Plot |
|---|---|
| CZT HV Monitor |  |
| D_VDD |  |
| Temperature 1 |  |
| Veto HV Monitor |  |
| Veto LLD |  |
| Alpha Counter |  |
| _CPM_Rate |  |
| CZT Counter |  |
| +2.5 Volts monitor | 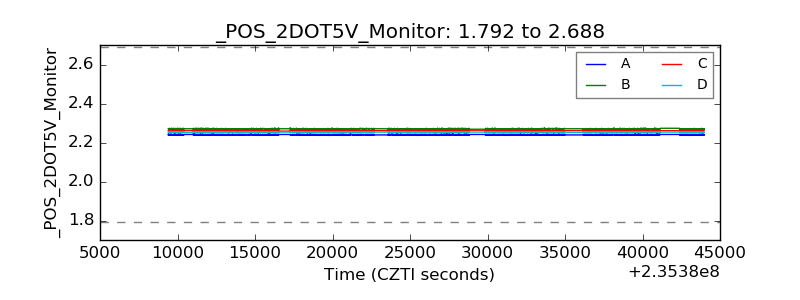 |
| +5 Volts monitor |  |
| _ROLL_ROT |  |
| _Roll_DEC |  |
| _Roll_RA | 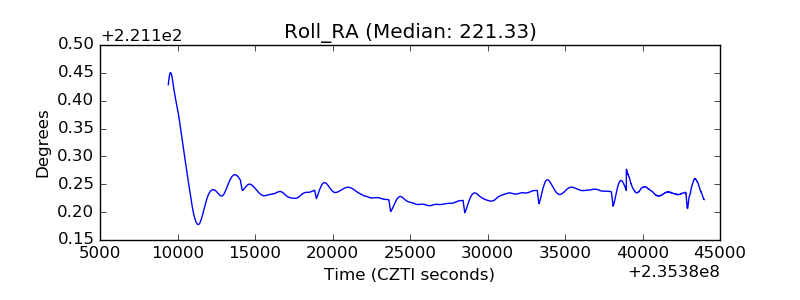 |
| Veto Counter |  |