| Param | Original file | Final file |
|---|---|---|
| Filename | modeM0/AS1G07_077T03_9000001310cztM0_level2.evt | modeM0/AS1G07_077T03_9000001310cztM0_level2_quad_clean.evt |
| Size (bytes) | 2,890,725,120 | 511,922,880 |
| Size | 2.7 GB | 488.2 MB |
| Events in quadrant A | 24,760,744 | 3,158,874 |
| Events in quadrant B | 18,967,124 | 3,284,089 |
| Events in quadrant C | 18,067,950 | 3,264,630 |
| Events in quadrant D | 23,050,630 | 3,051,913 |
| Mode SS | |||
|---|---|---|---|
| Quadrant | BADHDUFLAG | Total packets | Discarded packets |
| A | 0 | 815 | 0 |
| B | 0 | 816 | 0 |
| C | 0 | 824 | 0 |
| D | 0 | 818 | 0 |
| Mode M9 | |||
|---|---|---|---|
| Quadrant | BADHDUFLAG | Total packets | Discarded packets |
| A | 0 | 57 | 0 |
| B | 0 | 60 | 0 |
| C | 0 | 58 | 0 |
| D | 0 | 59 | 0 |
| Mode M0 | |||
|---|---|---|---|
| Quadrant | BADHDUFLAG | Total packets | Discarded packets |
| A | 0 | 99846 | 0 |
| B | 0 | 83492 | 0 |
| C | 0 | 82231 | 0 |
| D | 0 | 97190 | 0 |
| Quadrant | Total seconds | Saturated seconds | Saturation percentage |
|---|---|---|---|
| A | 39799 | 1238 | 3.110631% |
| B | 40014 | 722 | 1.804368% |
| C | 40075 | 466 | 1.162820% |
| D | 39879 | 1945 | 4.877254% |
Noise dominated data is calculated using 1-second bins in cleaned event files. If a bin has >2000 counts, and if more than 50% of those come from <1% of pixels, then it is considered to be noise-dominated and hence unusable.
| Quadrant | # 1 sec bins | Bins with >0 counts | Bins with >2000 counts | High rate bins dominated by noise | Noise dominated (total time) | Noise dominated (detector-on time) | Marked lightcurve |
|---|---|---|---|---|---|---|---|
| A | 53199 | 40880 | 325 | 325 | 0.61% | 0.80% |  |
| B | 53199 | 41097 | 9 | 9 | 0.02% | 0.02% |  |
| C | 53199 | 41168 | 7 | 7 | 0.01% | 0.02% |  |
| D | 53199 | 40961 | 1336 | 1336 | 2.51% | 3.26% |  |
Top three noisy pixels from each quadrant. If the there are fewer than three noisy pixels in the level2.evt file, extra rows are filled as -1
| Pixel properties | Quadrant properties | ||||||
|---|---|---|---|---|---|---|---|
| Quadrant | DetID | PixID | Counts | Sigma | Mean | Median | Sigma |
| A | 8 | 5 | 5266426 | 5681.82 | 4591 | 4486 | 926.1 |
| A | 15 | 223 | 377249 | 402.51 | 4591 | 4486 | 926.1 |
| A | 15 | 239 | 363044 | 387.17 | 4591 | 4486 | 926.1 |
| B | 0 | 214 | 343613 | 384.77 | 4689 | 4575 | 881.1 |
| B | 4 | 80 | 197736 | 219.22 | 4689 | 4575 | 881.1 |
| B | 12 | 111 | 98235 | 106.29 | 4689 | 4575 | 881.1 |
| C | 14 | 67 | 96286 | 86.85 | 4583 | 4598 | 1055.7 |
| C | 10 | 22 | 67536 | 59.62 | 4583 | 4598 | 1055.7 |
| C | 13 | 61 | 34685 | 28.5 | 4583 | 4598 | 1055.7 |
| D | 12 | 227 | 3404028 | 3128.37 | 4419 | 4314 | 1086.7 |
| D | 1 | 52 | 1188715 | 1089.87 | 4419 | 4314 | 1086.7 |
| D | 12 | 233 | 609162 | 556.57 | 4419 | 4314 | 1086.7 |
Histogram calculated using DETX and DETY for each event in the final _common_clean file
| Quadrant A | 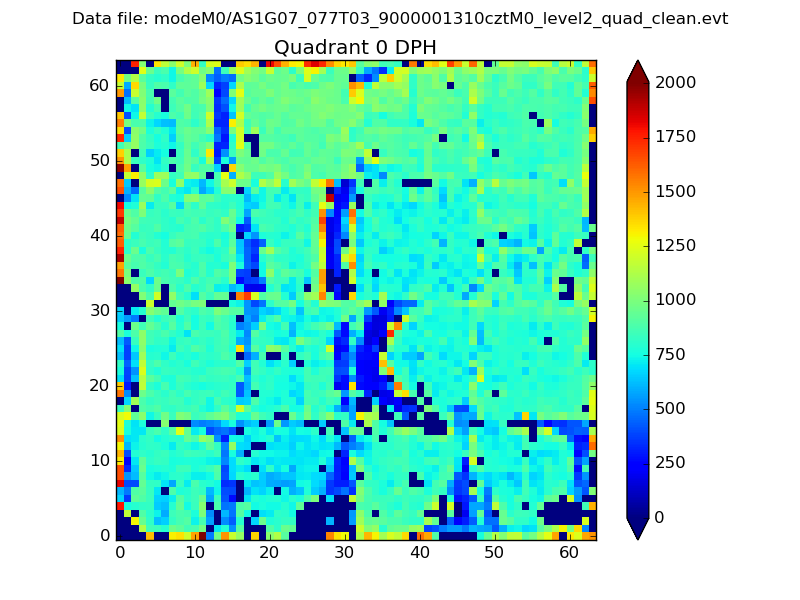 |
 |
Quadrant B |
|---|---|---|---|
| Quadrant D |  |
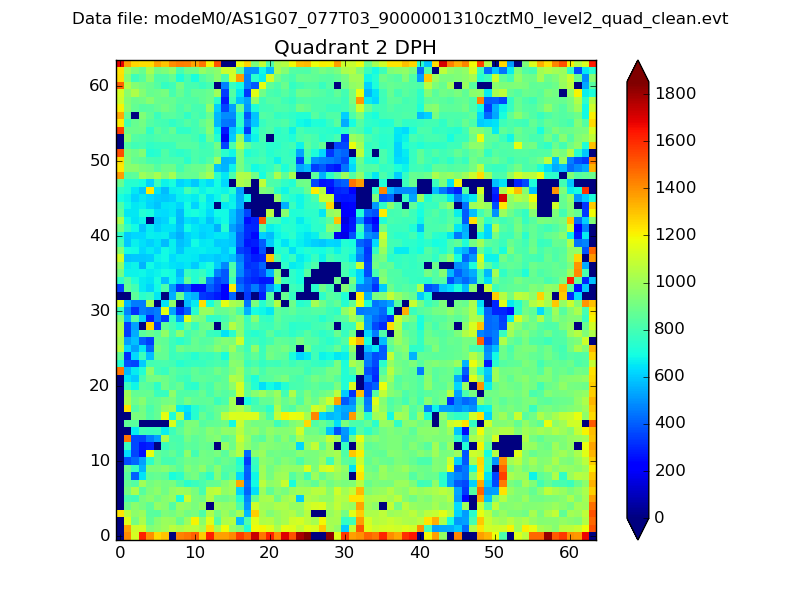 |
Quadrant C |
| Plot type | Count rate plots | Images |
|---|---|---|
| Comparison with Poisson distribution Blue bars denote a histogram of data divided into 1 sec bins. Red curve is a Poisson curve with rate = median count rate of data. |
 |
 |
| Quadrant-wise count rates Data is divided into 100 sec bins |
 |
|
| Module-wise count rates for Quadrant A Data is divided into 100 sec bins |
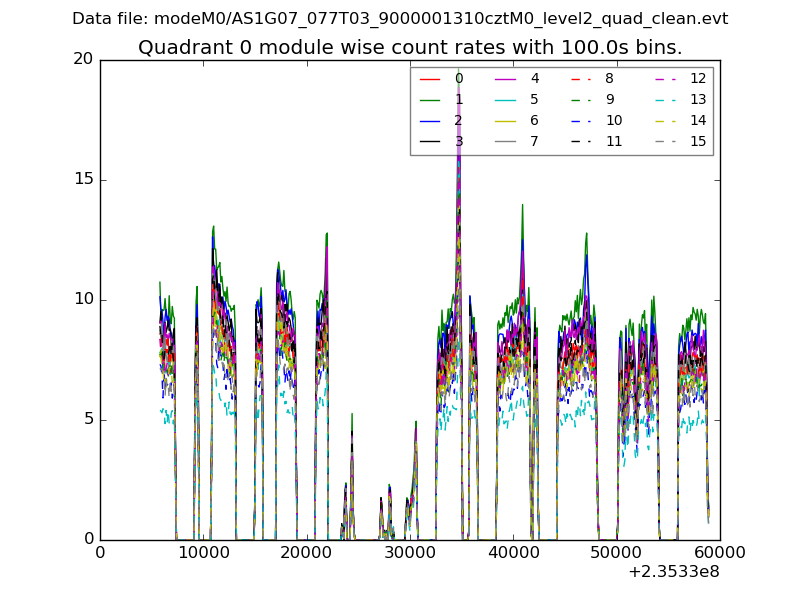 |
 |
| Module-wise count rates for Quadrant B Data is divided into 100 sec bins |
 |
 |
| Module-wise count rates for Quadrant C Data is divided into 100 sec bins |
 |
 |
| Module-wise count rates for Quadrant D Data is divided into 100 sec bins |
 |
 |
| Parameter | Plot |
|---|---|
| CZT HV Monitor |  |
| D_VDD |  |
| Temperature 1 |  |
| Veto HV Monitor | 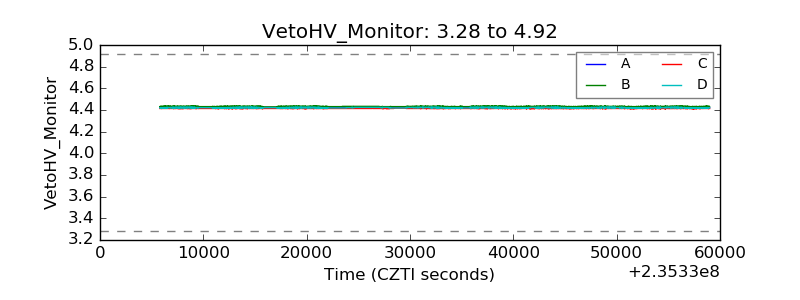 |
| Veto LLD |  |
| Alpha Counter |  |
| _CPM_Rate |  |
| CZT Counter | 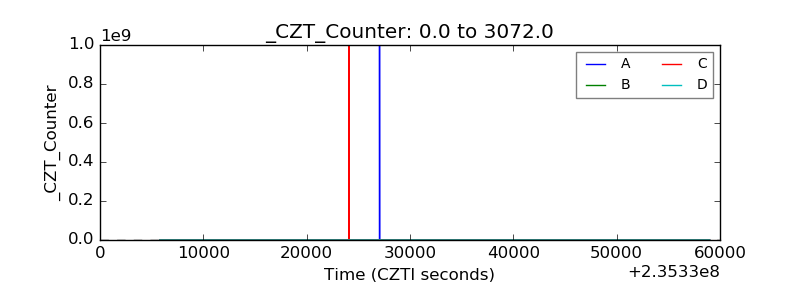 |
| +2.5 Volts monitor |  |
| +5 Volts monitor |  |
| _ROLL_ROT | 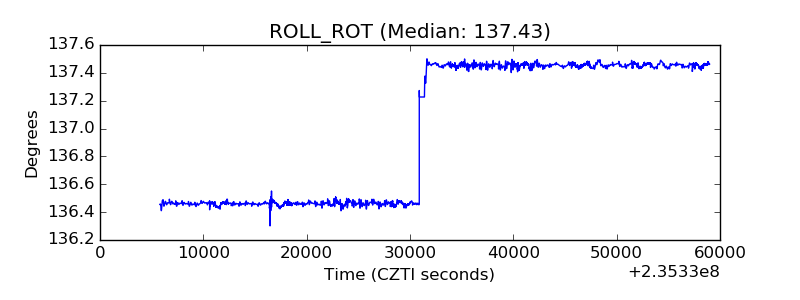 |
| _Roll_DEC | 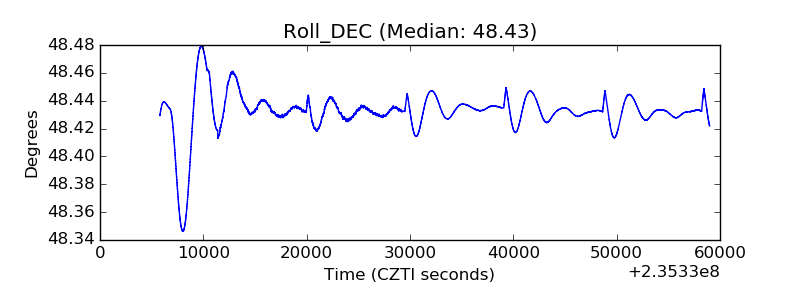 |
| _Roll_RA |  |
| Veto Counter |  |