| Param | Original file | Final file |
|---|---|---|
| Filename | modeM0/AS1G07_077T02_9000001308cztM0_level2.evt | modeM0/AS1G07_077T02_9000001308cztM0_level2_quad_clean.evt |
| Size (bytes) | 1,821,504,960 | 340,056,000 |
| Size | 1.7 GB | 324.3 MB |
| Events in quadrant A | 16,326,961 | 2,138,985 |
| Events in quadrant B | 12,033,033 | 2,190,380 |
| Events in quadrant C | 11,063,096 | 2,190,184 |
| Events in quadrant D | 14,082,120 | 2,089,907 |
| Mode M0 | |||
|---|---|---|---|
| Quadrant | BADHDUFLAG | Total packets | Discarded packets |
| A | 0 | 65032 | 0 |
| B | 0 | 52528 | 0 |
| C | 0 | 50279 | 0 |
| D | 0 | 58742 | 0 |
| Mode M9 | |||
|---|---|---|---|
| Quadrant | BADHDUFLAG | Total packets | Discarded packets |
| A | 0 | 39 | 0 |
| B | 0 | 39 | 0 |
| C | 0 | 39 | 0 |
| D | 0 | 39 | 0 |
| Mode SS | |||
|---|---|---|---|
| Quadrant | BADHDUFLAG | Total packets | Discarded packets |
| A | 0 | 502 | 0 |
| B | 0 | 502 | 0 |
| C | 0 | 502 | 0 |
| D | 0 | 502 | 0 |
| Quadrant | Total seconds | Saturated seconds | Saturation percentage |
|---|---|---|---|
| A | 24514 | 955 | 3.895733% |
| B | 24577 | 298 | 1.212516% |
| C | 24621 | 185 | 0.751391% |
| D | 24566 | 591 | 2.405764% |
Noise dominated data is calculated using 1-second bins in cleaned event files. If a bin has >2000 counts, and if more than 50% of those come from <1% of pixels, then it is considered to be noise-dominated and hence unusable.
| Quadrant | # 1 sec bins | Bins with >0 counts | Bins with >2000 counts | High rate bins dominated by noise | Noise dominated (total time) | Noise dominated (detector-on time) | Marked lightcurve |
|---|---|---|---|---|---|---|---|
| A | 34479 | 24827 | 344 | 344 | 1.00% | 1.39% |  |
| B | 34479 | 24839 | 20 | 20 | 0.06% | 0.08% |  |
| C | 34479 | 24842 | 0 | 0 | 0.00% | 0.00% |  |
| D | 34479 | 24835 | 263 | 263 | 0.76% | 1.06% |  |
Top three noisy pixels from each quadrant. If the there are fewer than three noisy pixels in the level2.evt file, extra rows are filled as -1
| Pixel properties | Quadrant properties | ||||||
|---|---|---|---|---|---|---|---|
| Quadrant | DetID | PixID | Counts | Sigma | Mean | Median | Sigma |
| A | 8 | 5 | 3790269 | 6666.99 | 2819 | 2755 | 568.1 |
| A | 15 | 223 | 776408 | 1361.83 | 2819 | 2755 | 568.1 |
| A | 15 | 239 | 434730 | 760.39 | 2819 | 2755 | 568.1 |
| B | 0 | 214 | 259359 | 474.23 | 2877 | 2806 | 541.0 |
| B | 8 | 234 | 204201 | 372.27 | 2877 | 2806 | 541.0 |
| B | 0 | 219 | 122629 | 221.49 | 2877 | 2806 | 541.0 |
| C | 14 | 67 | 32110 | 44.9 | 2820 | 2830 | 652.0 |
| C | 13 | 61 | 21442 | 28.54 | 2820 | 2830 | 652.0 |
| C | 12 | 4 | 15266 | 19.07 | 2820 | 2830 | 652.0 |
| D | 1 | 52 | 1953142 | 2825.5 | 2772 | 2703 | 690.3 |
| D | 12 | 233 | 741762 | 1070.64 | 2772 | 2703 | 690.3 |
| D | 7 | 71 | 370554 | 532.89 | 2772 | 2703 | 690.3 |
Histogram calculated using DETX and DETY for each event in the final _common_clean file
| Quadrant A |  |
 |
Quadrant B |
|---|---|---|---|
| Quadrant D |  |
 |
Quadrant C |
| Plot type | Count rate plots | Images |
|---|---|---|
| Comparison with Poisson distribution Blue bars denote a histogram of data divided into 1 sec bins. Red curve is a Poisson curve with rate = median count rate of data. |
 |
 |
| Quadrant-wise count rates Data is divided into 100 sec bins |
 |
|
| Module-wise count rates for Quadrant A Data is divided into 100 sec bins |
 |
 |
| Module-wise count rates for Quadrant B Data is divided into 100 sec bins |
 |
 |
| Module-wise count rates for Quadrant C Data is divided into 100 sec bins |
 |
 |
| Module-wise count rates for Quadrant D Data is divided into 100 sec bins |
 |
 |
| Parameter | Plot |
|---|---|
| CZT HV Monitor |  |
| D_VDD | 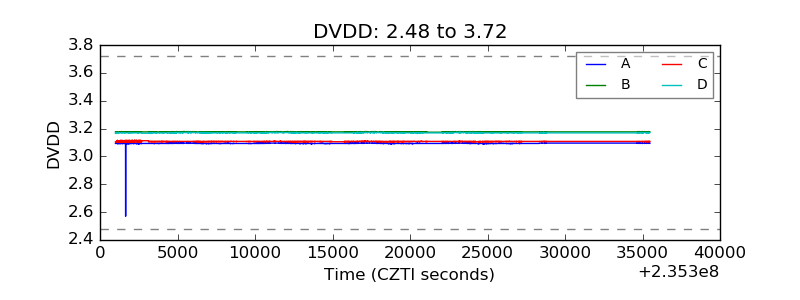 |
| Temperature 1 | 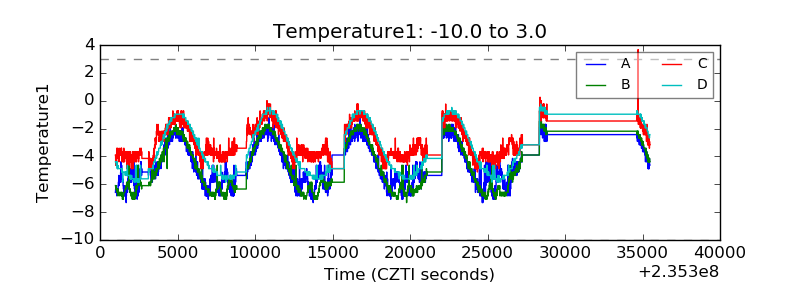 |
| Veto HV Monitor |  |
| Veto LLD |  |
| Alpha Counter |  |
| _CPM_Rate |  |
| CZT Counter |  |
| +2.5 Volts monitor |  |
| +5 Volts monitor |  |
| _ROLL_ROT | 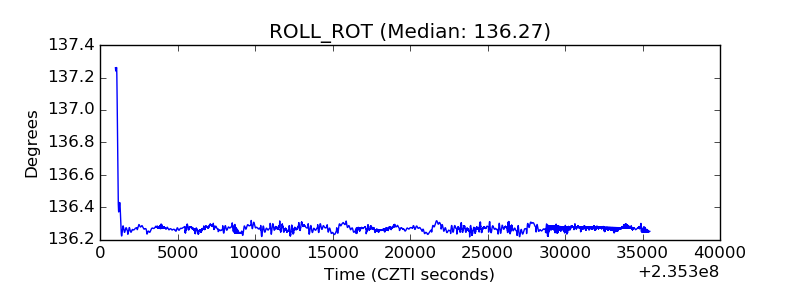 |
| _Roll_DEC |  |
| _Roll_RA |  |
| Veto Counter |  |