| Param | Original file | Final file |
|---|---|---|
| Filename | modeM0/AS1G07_027T01_9000001304cztM0_level2.evt | modeM0/AS1G07_027T01_9000001304cztM0_level2_quad_clean.evt |
| Size (bytes) | 774,489,600 | 145,157,760 |
| Size | 738.6 MB | 138.4 MB |
| Events in quadrant A | 7,867,968 | 918,560 |
| Events in quadrant B | 4,873,815 | 961,055 |
| Events in quadrant C | 4,622,917 | 940,231 |
| Events in quadrant D | 5,440,205 | 909,832 |
| Mode M0 | |||
|---|---|---|---|
| Quadrant | BADHDUFLAG | Total packets | Discarded packets |
| A | 0 | 29762 | 0 |
| B | 0 | 20581 | 0 |
| C | 0 | 19928 | 0 |
| D | 0 | 22482 | 0 |
| Mode M9 | |||
|---|---|---|---|
| Quadrant | BADHDUFLAG | Total packets | Discarded packets |
| A | 0 | 25 | 0 |
| B | 0 | 25 | 0 |
| C | 0 | 26 | 0 |
| D | 0 | 26 | 0 |
| Mode SS | |||
|---|---|---|---|
| Quadrant | BADHDUFLAG | Total packets | Discarded packets |
| A | 0 | 210 | 0 |
| B | 0 | 200 | 0 |
| C | 0 | 196 | 0 |
| D | 0 | 202 | 0 |
| Quadrant | Total seconds | Saturated seconds | Saturation percentage |
|---|---|---|---|
| A | 9410 | 337 | 3.581296% |
| B | 9665 | 143 | 1.479565% |
| C | 9658 | 116 | 1.201077% |
| D | 9657 | 241 | 2.495599% |
Noise dominated data is calculated using 1-second bins in cleaned event files. If a bin has >2000 counts, and if more than 50% of those come from <1% of pixels, then it is considered to be noise-dominated and hence unusable.
| Quadrant | # 1 sec bins | Bins with >0 counts | Bins with >2000 counts | High rate bins dominated by noise | Noise dominated (total time) | Noise dominated (detector-on time) | Marked lightcurve |
|---|---|---|---|---|---|---|---|
| A | 17661 | 9791 | 103 | 103 | 0.58% | 1.05% |  |
| B | 17707 | 10079 | 6 | 6 | 0.03% | 0.06% |  |
| C | 17684 | 10087 | 2 | 2 | 0.01% | 0.02% | 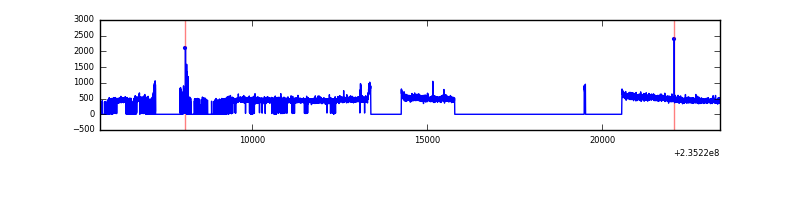 |
| D | 17680 | 10058 | 93 | 93 | 0.53% | 0.92% |  |
Top three noisy pixels from each quadrant. If the there are fewer than three noisy pixels in the level2.evt file, extra rows are filled as -1
| Pixel properties | Quadrant properties | ||||||
|---|---|---|---|---|---|---|---|
| Quadrant | DetID | PixID | Counts | Sigma | Mean | Median | Sigma |
| A | 8 | 5 | 2987540 | 12627.24 | 1160 | 1137 | 236.5 |
| A | 4 | 2 | 223546 | 940.4 | 1160 | 1137 | 236.5 |
| A | 5 | 16 | 63688 | 264.48 | 1160 | 1137 | 236.5 |
| B | 0 | 214 | 85096 | 361.93 | 1208 | 1179 | 231.9 |
| B | 0 | 245 | 30634 | 127.04 | 1208 | 1179 | 231.9 |
| B | 0 | 230 | 29546 | 122.35 | 1208 | 1179 | 231.9 |
| C | 14 | 234 | 21114 | 73.24 | 1176 | 1186 | 272.1 |
| C | 13 | 61 | 8785 | 27.93 | 1176 | 1186 | 272.1 |
| C | 14 | 67 | 7213 | 22.15 | 1176 | 1186 | 272.1 |
| D | 1 | 52 | 582996 | 1849.48 | 1157 | 1135 | 314.6 |
| D | 12 | 233 | 220577 | 697.51 | 1157 | 1135 | 314.6 |
| D | 2 | 136 | 109583 | 344.71 | 1157 | 1135 | 314.6 |
Histogram calculated using DETX and DETY for each event in the final _common_clean file
| Quadrant A | 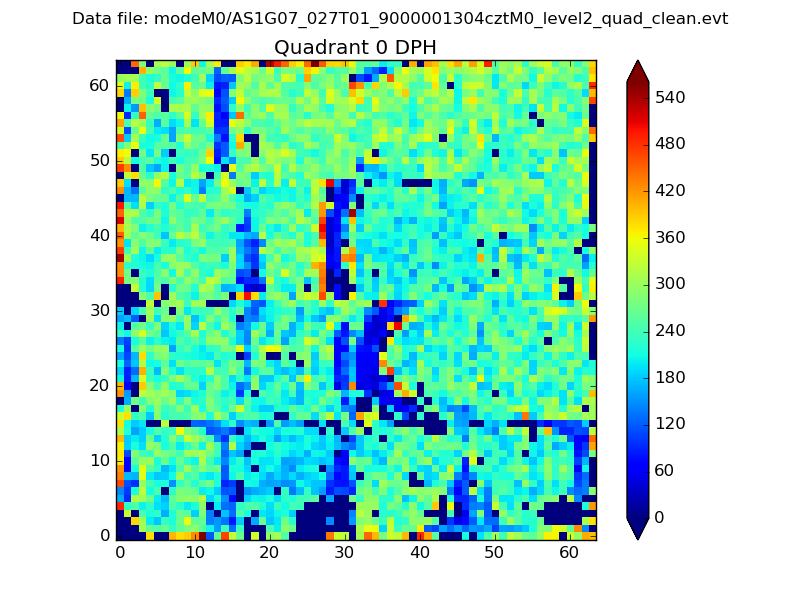 |
 |
Quadrant B |
|---|---|---|---|
| Quadrant D |  |
 |
Quadrant C |
| Plot type | Count rate plots | Images |
|---|---|---|
| Comparison with Poisson distribution Blue bars denote a histogram of data divided into 1 sec bins. Red curve is a Poisson curve with rate = median count rate of data. |
 |
 |
| Quadrant-wise count rates Data is divided into 100 sec bins |
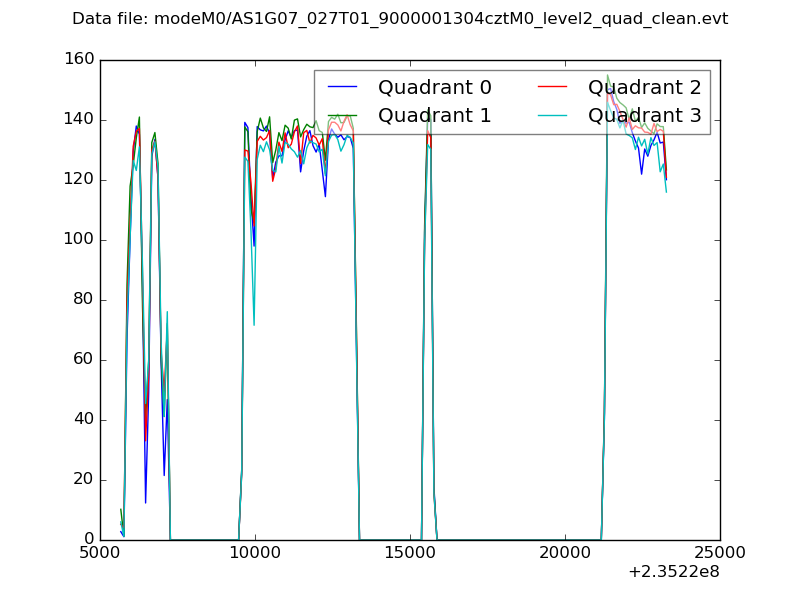 |
|
| Module-wise count rates for Quadrant A Data is divided into 100 sec bins |
 |
 |
| Module-wise count rates for Quadrant B Data is divided into 100 sec bins |
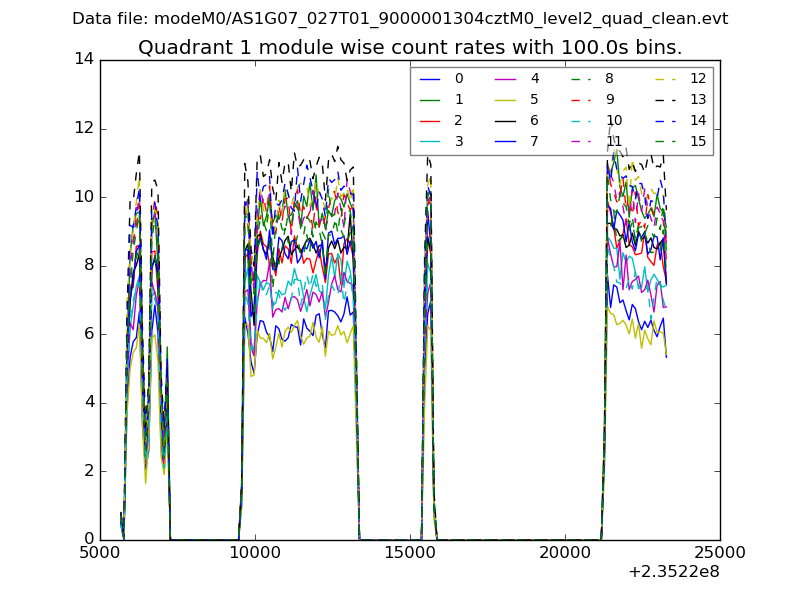 |
 |
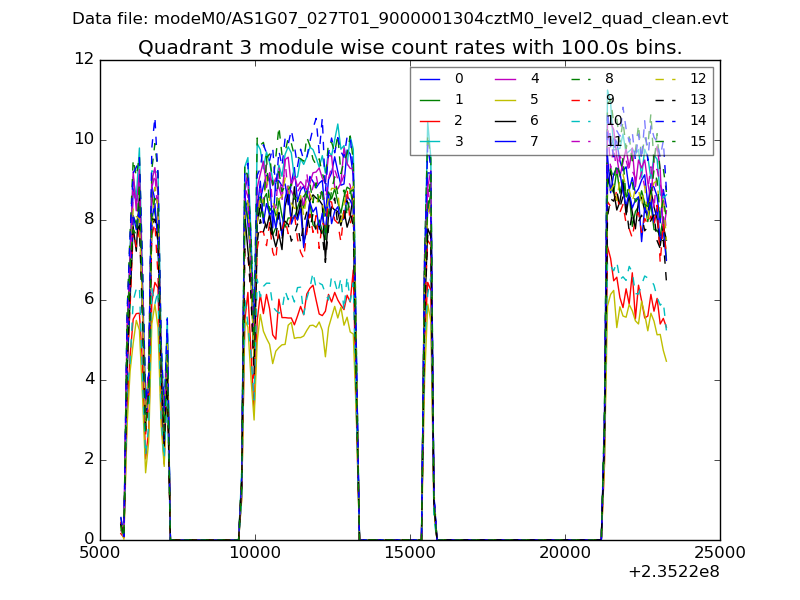
| Module-wise count rates for Quadrant C Data is divided into 100 sec bins |
 |
 |
| Module-wise count rates for Quadrant D Data is divided into 100 sec bins |
 |
 |
| Parameter | Plot |
|---|---|
| CZT HV Monitor |  |
| D_VDD | 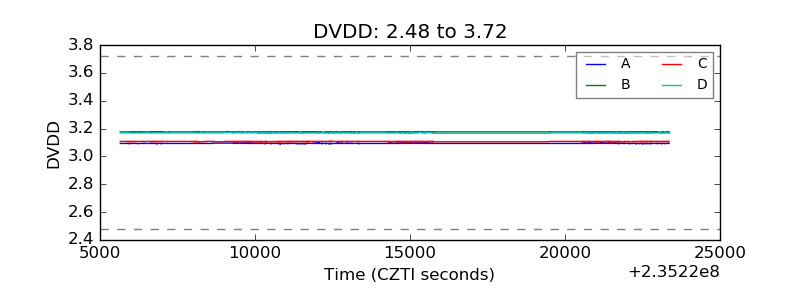 |
| Temperature 1 |  |
| Veto HV Monitor |  |
| Veto LLD |  |
| Alpha Counter |  |
| _CPM_Rate | 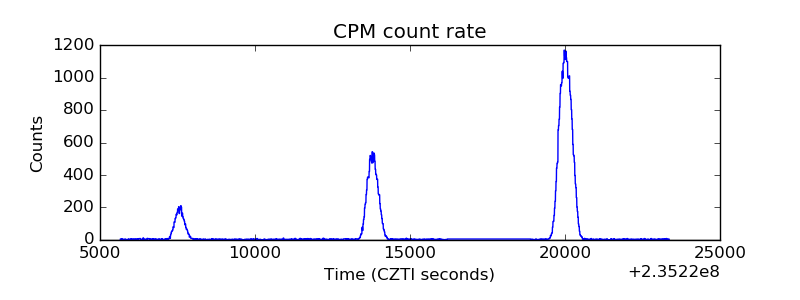 |
| CZT Counter |  |
| +2.5 Volts monitor |  |
| +5 Volts monitor |  |
| _ROLL_ROT |  |
| _Roll_DEC | 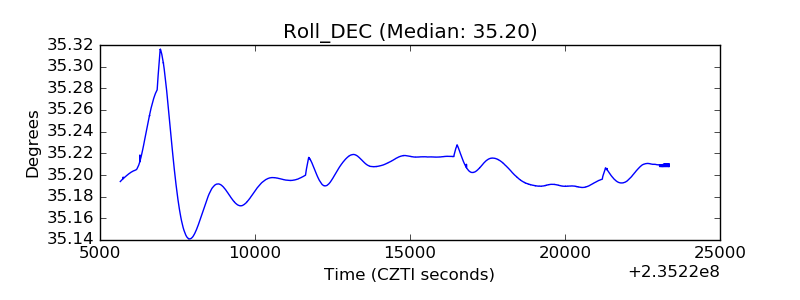 |
| _Roll_RA | 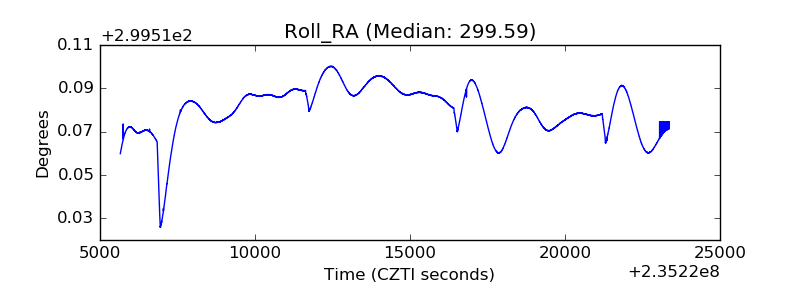 |
| Veto Counter |  |