| Param | Original file | Final file |
|---|---|---|
| Filename | modeM0/AS1A03_091T06_9000001302cztM0_level2.evt | modeM0/AS1A03_091T06_9000001302cztM0_level2_quad_clean.evt |
| Size (bytes) | 1,105,545,600 | 171,936,000 |
| Size | 1.0 GB | 164.0 MB |
| Events in quadrant A | 9,966,634 | 1,040,687 |
| Events in quadrant B | 7,272,630 | 1,076,874 |
| Events in quadrant C | 6,758,657 | 1,066,759 |
| Events in quadrant D | 8,486,666 | 1,006,160 |
| Mode M0 | |||
|---|---|---|---|
| Quadrant | BADHDUFLAG | Total packets | Discarded packets |
| A | 0 | 39423 | 0 |
| B | 0 | 31151 | 0 |
| C | 0 | 30429 | 0 |
| D | 0 | 35291 | 0 |
| Mode M9 | |||
|---|---|---|---|
| Quadrant | BADHDUFLAG | Total packets | Discarded packets |
| A | 0 | 10 | 0 |
| B | 0 | 9 | 0 |
| C | 0 | 10 | 0 |
| D | 0 | 10 | 0 |
| Mode SS | |||
|---|---|---|---|
| Quadrant | BADHDUFLAG | Total packets | Discarded packets |
| A | 0 | 304 | 0 |
| B | 0 | 310 | 0 |
| C | 0 | 298 | 0 |
| D | 0 | 302 | 0 |
| Quadrant | Total seconds | Saturated seconds | Saturation percentage |
|---|---|---|---|
| A | 14574 | 749 | 5.139289% |
| B | 14707 | 467 | 3.175359% |
| C | 14803 | 340 | 2.296832% |
| D | 14736 | 727 | 4.933496% |
Noise dominated data is calculated using 1-second bins in cleaned event files. If a bin has >2000 counts, and if more than 50% of those come from <1% of pixels, then it is considered to be noise-dominated and hence unusable.
| Quadrant | # 1 sec bins | Bins with >0 counts | Bins with >2000 counts | High rate bins dominated by noise | Noise dominated (total time) | Noise dominated (detector-on time) | Marked lightcurve |
|---|---|---|---|---|---|---|---|
| A | 17115 | 15288 | 183 | 183 | 1.07% | 1.20% |  |
| B | 17115 | 15399 | 13 | 13 | 0.08% | 0.08% |  |
| C | 17115 | 15465 | 0 | 0 | 0.00% | 0.00% |  |
| D | 17115 | 15408 | 329 | 329 | 1.92% | 2.14% |  |
Top three noisy pixels from each quadrant. If the there are fewer than three noisy pixels in the level2.evt file, extra rows are filled as -1
| Pixel properties | Quadrant properties | ||||||
|---|---|---|---|---|---|---|---|
| Quadrant | DetID | PixID | Counts | Sigma | Mean | Median | Sigma |
| A | 8 | 5 | 2270419 | 6458.57 | 1725 | 1683 | 351.3 |
| A | 5 | 16 | 773157 | 2196.21 | 1725 | 1683 | 351.3 |
| A | 4 | 2 | 88969 | 248.48 | 1725 | 1683 | 351.3 |
| B | 0 | 214 | 180265 | 527.15 | 1763 | 1714 | 338.7 |
| B | 8 | 234 | 86774 | 251.13 | 1763 | 1714 | 338.7 |
| B | 12 | 111 | 37290 | 105.03 | 1763 | 1714 | 338.7 |
| C | 9 | 68 | 21263 | 48.52 | 1724 | 1731 | 402.5 |
| C | 13 | 61 | 13117 | 28.29 | 1724 | 1731 | 402.5 |
| C | 8 | 222 | 9394 | 19.04 | 1724 | 1731 | 402.5 |
| D | 12 | 233 | 639984 | 1410.58 | 1687 | 1643 | 452.5 |
| D | 10 | 199 | 461203 | 1015.52 | 1687 | 1643 | 452.5 |
| D | 1 | 52 | 370841 | 815.84 | 1687 | 1643 | 452.5 |
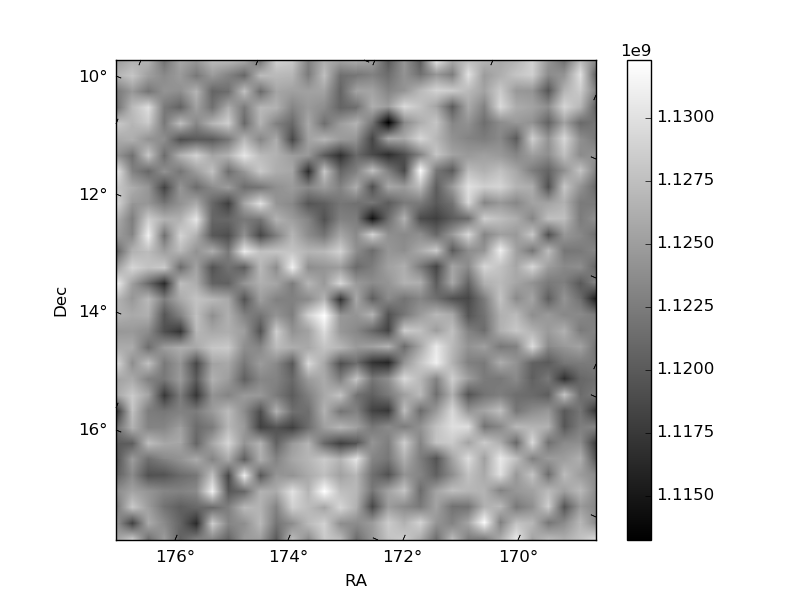
Histogram calculated using DETX and DETY for each event in the final _common_clean file
| Quadrant A |  |
 |
Quadrant B |
|---|---|---|---|
| Quadrant D |  |
 |
Quadrant C |
| Plot type | Count rate plots | Images |
|---|---|---|
| Comparison with Poisson distribution Blue bars denote a histogram of data divided into 1 sec bins. Red curve is a Poisson curve with rate = median count rate of data. |
 |
 |
| Quadrant-wise count rates Data is divided into 100 sec bins |
 |
|
| Module-wise count rates for Quadrant A Data is divided into 100 sec bins |
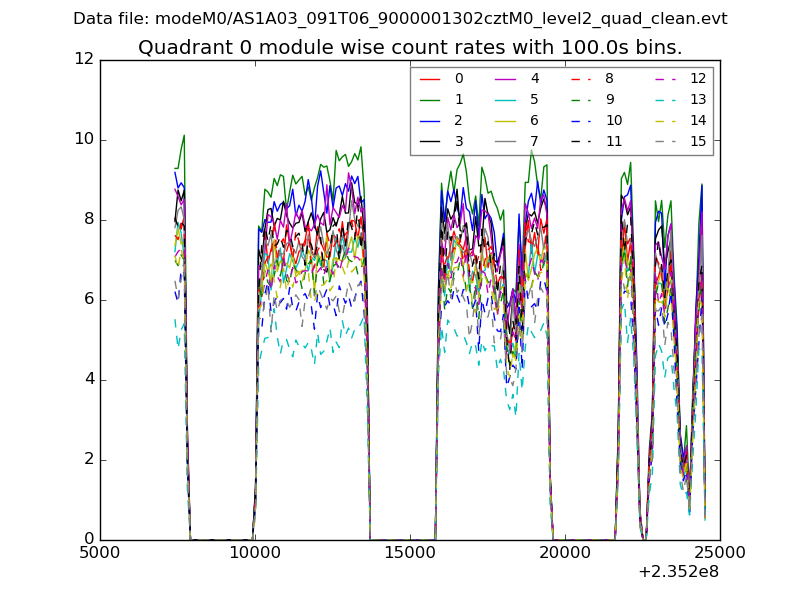 |
 |
| Module-wise count rates for Quadrant B Data is divided into 100 sec bins |
 |
 |
| Module-wise count rates for Quadrant C Data is divided into 100 sec bins |
 |
 |
| Module-wise count rates for Quadrant D Data is divided into 100 sec bins |
 |
 |
| Parameter | Plot |
|---|---|
| CZT HV Monitor |  |
| D_VDD |  |
| Temperature 1 |  |
| Veto HV Monitor |  |
| Veto LLD |  |
| Alpha Counter |  |
| _CPM_Rate |  |
| CZT Counter |  |
| +2.5 Volts monitor |  |
| +5 Volts monitor |  |
| _ROLL_ROT |  |
| _Roll_DEC |  |
| _Roll_RA |  |
| Veto Counter |  |