| Param | Original file | Final file |
|---|---|---|
| Filename | modeM0/AS1A03_091T05_9000001300cztM0_level2.evt | modeM0/AS1A03_091T05_9000001300cztM0_level2_quad_clean.evt |
| Size (bytes) | 2,524,504,320 | 400,691,520 |
| Size | 2.4 GB | 382.1 MB |
| Events in quadrant A | 22,273,356 | 2,436,281 |
| Events in quadrant B | 17,252,893 | 2,537,922 |
| Events in quadrant C | 16,042,420 | 2,458,975 |
| Events in quadrant D | 18,575,534 | 2,350,082 |
| Mode M9 | |||
|---|---|---|---|
| Quadrant | BADHDUFLAG | Total packets | Discarded packets |
| A | 0 | 62 | 0 |
| B | 0 | 62 | 0 |
| C | 0 | 62 | 0 |
| D | 0 | 62 | 0 |
| Mode M0 | |||
|---|---|---|---|
| Quadrant | BADHDUFLAG | Total packets | Discarded packets |
| A | 0 | 88343 | 0 |
| B | 0 | 73297 | 0 |
| C | 0 | 70809 | 0 |
| D | 0 | 78326 | 0 |
| Mode SS | |||
|---|---|---|---|
| Quadrant | BADHDUFLAG | Total packets | Discarded packets |
| A | 0 | 698 | 0 |
| B | 0 | 690 | 0 |
| C | 0 | 698 | 0 |
| D | 0 | 698 | 0 |
| Quadrant | Total seconds | Saturated seconds | Saturation percentage |
|---|---|---|---|
| A | 34231 | 1422 | 4.154129% |
| B | 34252 | 635 | 1.853906% |
| C | 34262 | 348 | 1.015703% |
| D | 34248 | 690 | 2.014716% |
Noise dominated data is calculated using 1-second bins in cleaned event files. If a bin has >2000 counts, and if more than 50% of those come from <1% of pixels, then it is considered to be noise-dominated and hence unusable.
| Quadrant | # 1 sec bins | Bins with >0 counts | Bins with >2000 counts | High rate bins dominated by noise | Noise dominated (total time) | Noise dominated (detector-on time) | Marked lightcurve |
|---|---|---|---|---|---|---|---|
| A | 40419 | 34351 | 705 | 705 | 1.74% | 2.05% | 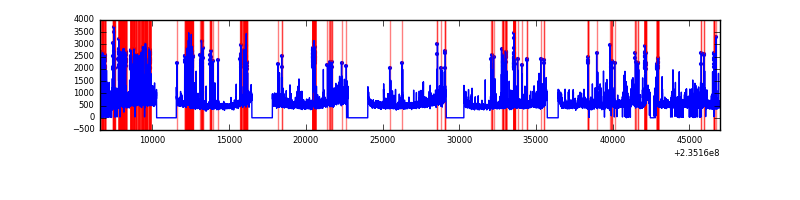 |
| B | 40419 | 34350 | 26 | 26 | 0.06% | 0.08% | 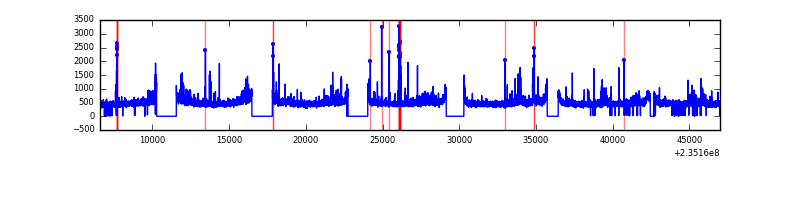 |
| C | 40419 | 34351 | 11 | 11 | 0.03% | 0.03% |  |
| D | 40419 | 34350 | 327 | 327 | 0.81% | 0.95% |  |
Top three noisy pixels from each quadrant. If the there are fewer than three noisy pixels in the level2.evt file, extra rows are filled as -1
| Pixel properties | Quadrant properties | ||||||
|---|---|---|---|---|---|---|---|
| Quadrant | DetID | PixID | Counts | Sigma | Mean | Median | Sigma |
| A | 8 | 5 | 3075397 | 3723.95 | 4097 | 4017 | 824.8 |
| A | 5 | 16 | 2273699 | 2751.92 | 4097 | 4017 | 824.8 |
| A | 4 | 2 | 279869 | 334.46 | 4097 | 4017 | 824.8 |
| B | 0 | 214 | 417941 | 526.61 | 4179 | 4086 | 785.9 |
| B | 0 | 219 | 165428 | 205.3 | 4179 | 4086 | 785.9 |
| B | 0 | 245 | 118467 | 145.54 | 4179 | 4086 | 785.9 |
| C | 9 | 68 | 245491 | 259.59 | 4026 | 4040 | 930.1 |
| C | 14 | 234 | 67426 | 68.15 | 4026 | 4040 | 930.1 |
| C | 13 | 61 | 30417 | 28.36 | 4026 | 4040 | 930.1 |
| D | 1 | 52 | 1565171 | 1500.08 | 3967 | 3877 | 1040.8 |
| D | 12 | 233 | 669120 | 639.16 | 3967 | 3877 | 1040.8 |
| D | 2 | 136 | 602184 | 574.85 | 3967 | 3877 | 1040.8 |
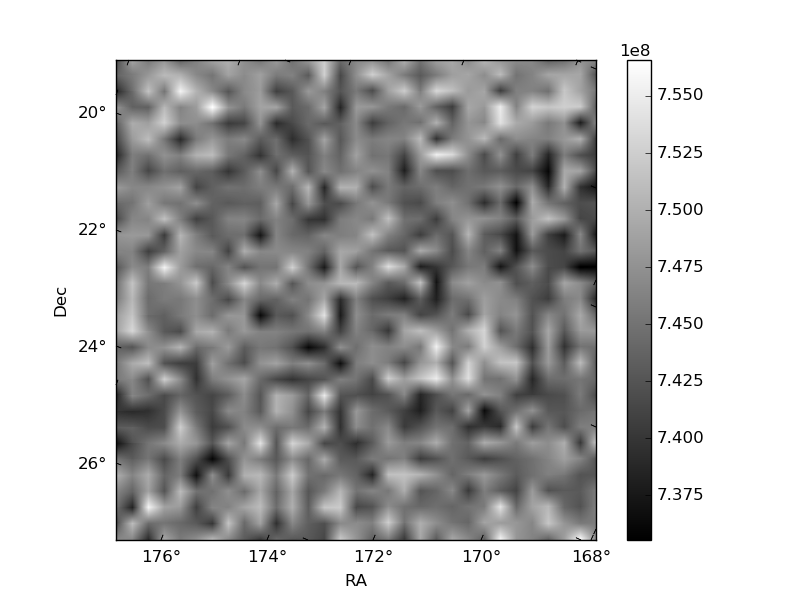
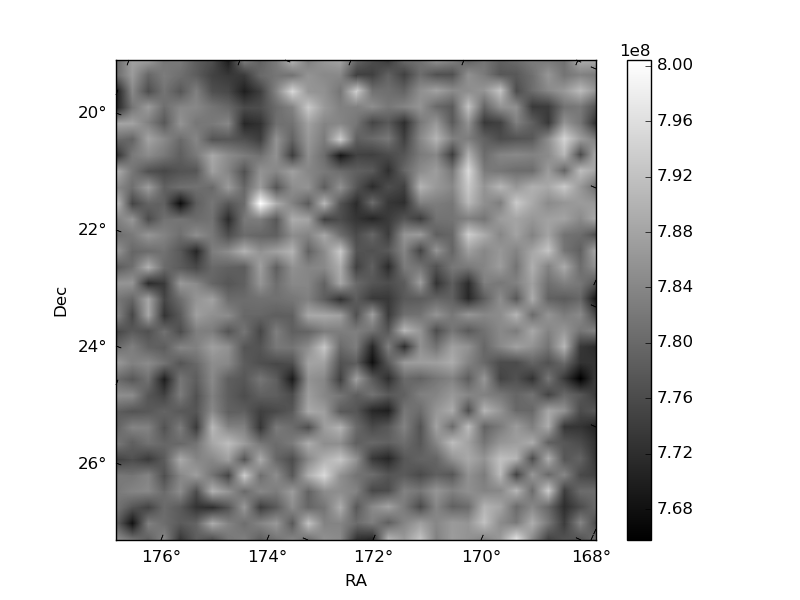
Histogram calculated using DETX and DETY for each event in the final _common_clean file
| Quadrant A |  |
 |
Quadrant B |
|---|---|---|---|
| Quadrant D |  |
 |
Quadrant C |
| Plot type | Count rate plots | Images |
|---|---|---|
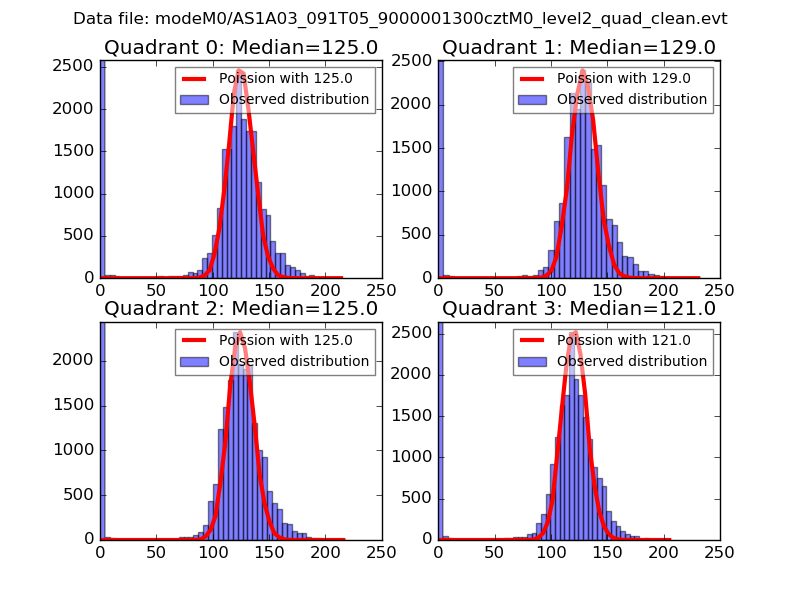
| Comparison with Poisson distribution Blue bars denote a histogram of data divided into 1 sec bins. Red curve is a Poisson curve with rate = median count rate of data. |
 |
 |
| Quadrant-wise count rates Data is divided into 100 sec bins |
 |
|
| Module-wise count rates for Quadrant A Data is divided into 100 sec bins |
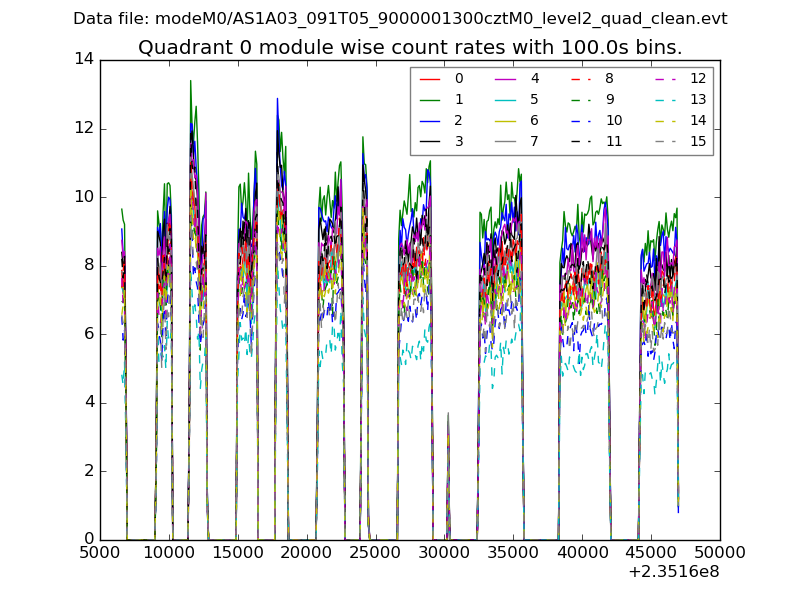 |
 |
| Module-wise count rates for Quadrant B Data is divided into 100 sec bins |
 |
 |
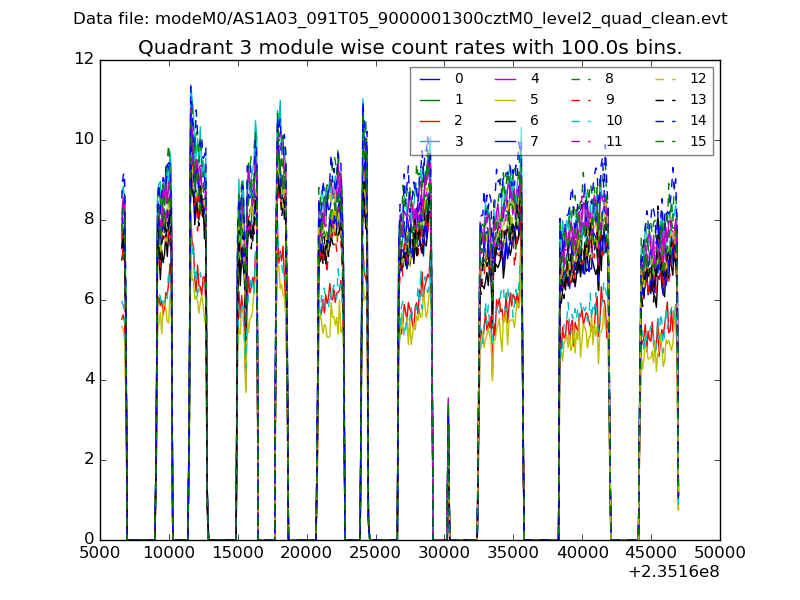
| Module-wise count rates for Quadrant C Data is divided into 100 sec bins |
 |
 |
| Module-wise count rates for Quadrant D Data is divided into 100 sec bins |
 |
 |
| Parameter | Plot |
|---|---|
| CZT HV Monitor |  |
| D_VDD |  |
| Temperature 1 | 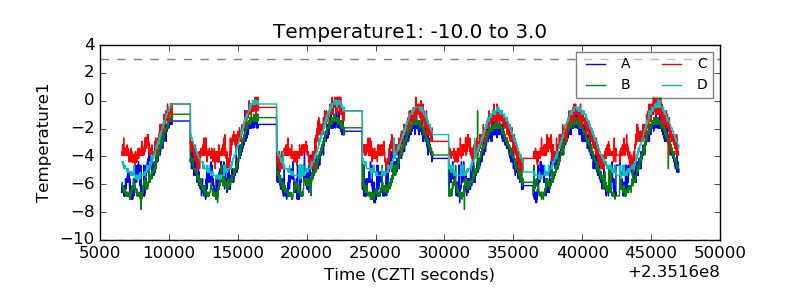 |
| Veto HV Monitor |  |
| Veto LLD |  |
| Alpha Counter |  |
| _CPM_Rate | 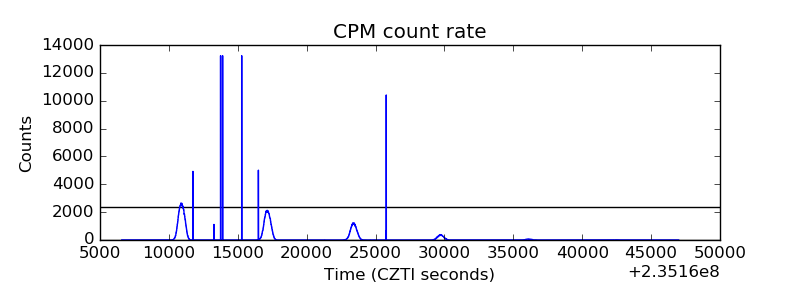 |
| CZT Counter |  |
| +2.5 Volts monitor |  |
| +5 Volts monitor | 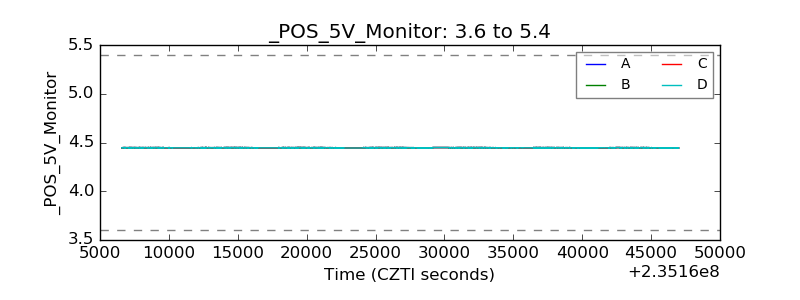 |
| _ROLL_ROT | 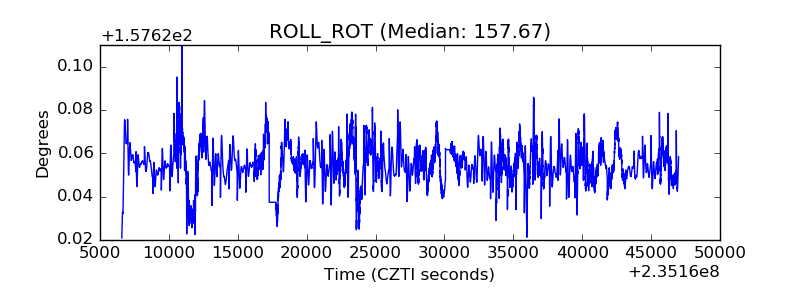 |
| _Roll_DEC | 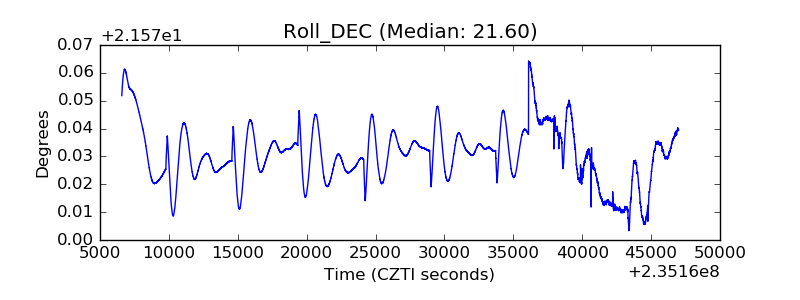 |
| _Roll_RA |  |
| Veto Counter | 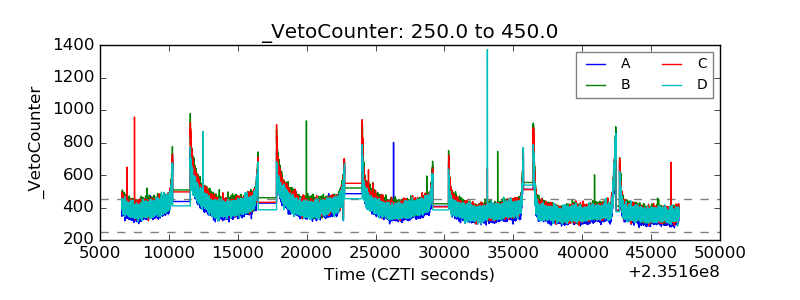 |