| Param | Original file | Final file |
|---|---|---|
| Filename | modeM0/AS1A03_091T04_9000001294cztM0_level2.evt | modeM0/AS1A03_091T04_9000001294cztM0_level2_quad_clean.evt |
| Size (bytes) | 751,550,400 | 131,184,000 |
| Size | 716.7 MB | 125.1 MB |
| Events in quadrant A | 6,080,409 | 808,193 |
| Events in quadrant B | 5,412,280 | 821,702 |
| Events in quadrant C | 5,115,064 | 800,886 |
| Events in quadrant D | 5,405,412 | 779,337 |
| Mode SS | |||
|---|---|---|---|
| Quadrant | BADHDUFLAG | Total packets | Discarded packets |
| A | 0 | 226 | 0 |
| B | 0 | 226 | 0 |
| C | 0 | 226 | 0 |
| D | 0 | 226 | 0 |
| Mode M9 | |||
|---|---|---|---|
| Quadrant | BADHDUFLAG | Total packets | Discarded packets |
| A | 0 | 4 | 0 |
| B | 0 | 4 | 0 |
| C | 0 | 4 | 0 |
| D | 0 | 4 | 0 |
| Mode M0 | |||
|---|---|---|---|
| Quadrant | BADHDUFLAG | Total packets | Discarded packets |
| A | 0 | 24942 | 0 |
| B | 0 | 23235 | 0 |
| C | 0 | 22925 | 0 |
| D | 0 | 23898 | 0 |
| Quadrant | Total seconds | Saturated seconds | Saturation percentage |
|---|---|---|---|
| A | 11024 | 490 | 4.444848% |
| B | 11023 | 450 | 4.082373% |
| C | 11024 | 340 | 3.084180% |
| D | 11024 | 373 | 3.383527% |
Noise dominated data is calculated using 1-second bins in cleaned event files. If a bin has >2000 counts, and if more than 50% of those come from <1% of pixels, then it is considered to be noise-dominated and hence unusable.
| Quadrant | # 1 sec bins | Bins with >0 counts | Bins with >2000 counts | High rate bins dominated by noise | Noise dominated (total time) | Noise dominated (detector-on time) | Marked lightcurve |
|---|---|---|---|---|---|---|---|
| A | 11344 | 11030 | 17 | 17 | 0.15% | 0.15% |  |
| B | 11344 | 11030 | 1 | 1 | 0.01% | 0.01% |  |
| C | 11344 | 11030 | 3 | 3 | 0.03% | 0.03% |  |
| D | 11344 | 11030 | 47 | 47 | 0.41% | 0.43% |  |
Top three noisy pixels from each quadrant. If the there are fewer than three noisy pixels in the level2.evt file, extra rows are filled as -1
| Pixel properties | Quadrant properties | ||||||
|---|---|---|---|---|---|---|---|
| Quadrant | DetID | PixID | Counts | Sigma | Mean | Median | Sigma |
| A | 8 | 5 | 783581 | 2864.63 | 1323 | 1291 | 273.1 |
| A | 15 | 174 | 107681 | 389.58 | 1323 | 1291 | 273.1 |
| A | 1 | 162 | 50146 | 178.9 | 1323 | 1291 | 273.1 |
| B | 0 | 219 | 51407 | 194.55 | 1330 | 1293 | 257.6 |
| B | 0 | 214 | 50933 | 192.71 | 1330 | 1293 | 257.6 |
| B | 0 | 187 | 45592 | 171.97 | 1330 | 1293 | 257.6 |
| C | 14 | 234 | 29515 | 93.58 | 1296 | 1299 | 301.5 |
| C | 8 | 128 | 14098 | 42.45 | 1296 | 1299 | 301.5 |
| C | 13 | 61 | 9707 | 27.88 | 1296 | 1299 | 301.5 |
| D | 2 | 136 | 152654 | 448.19 | 1287 | 1254 | 337.8 |
| D | 1 | 52 | 149919 | 440.09 | 1287 | 1254 | 337.8 |
| D | 7 | 71 | 137646 | 403.76 | 1287 | 1254 | 337.8 |
Histogram calculated using DETX and DETY for each event in the final _common_clean file
| Quadrant A |  |
 |
Quadrant B |
|---|---|---|---|
| Quadrant D |  |
 |
Quadrant C |
| Plot type | Count rate plots | Images |
|---|---|---|
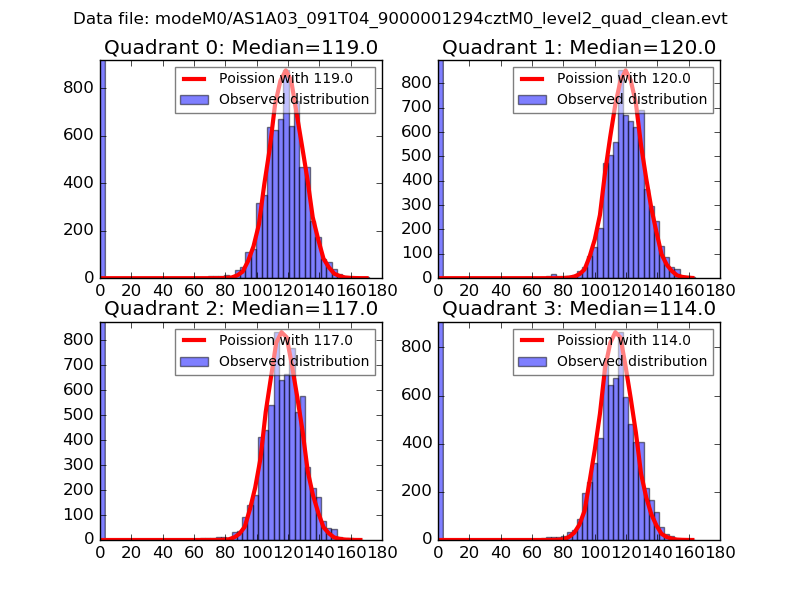
| Comparison with Poisson distribution Blue bars denote a histogram of data divided into 1 sec bins. Red curve is a Poisson curve with rate = median count rate of data. |
 |
 |
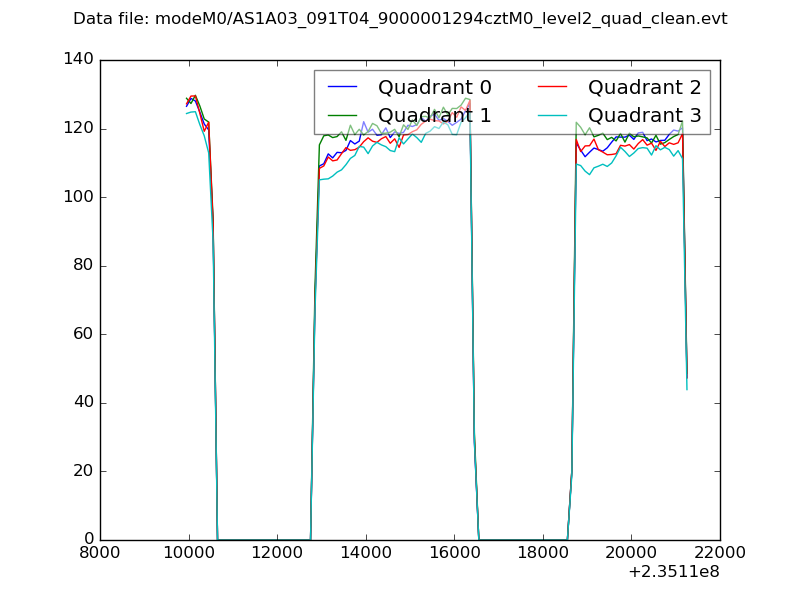
| Quadrant-wise count rates Data is divided into 100 sec bins |
 |
|
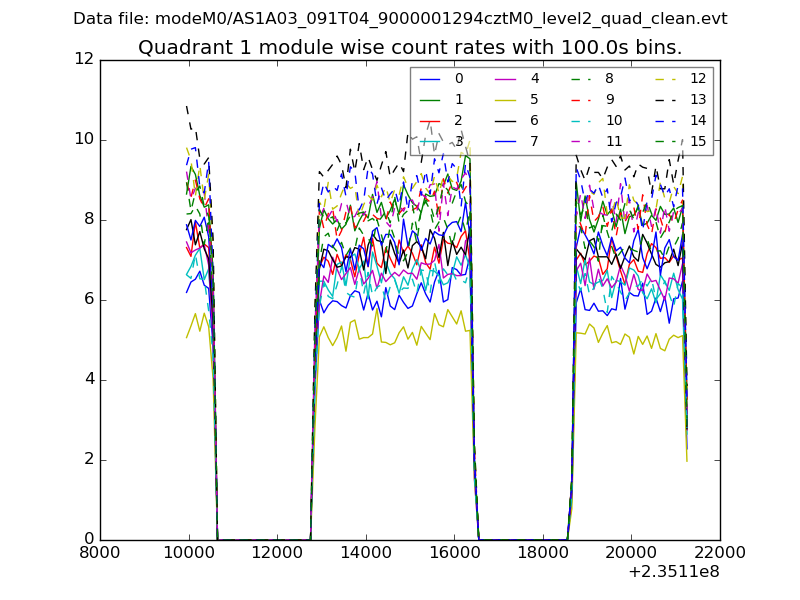
| Module-wise count rates for Quadrant A Data is divided into 100 sec bins |
 |
 |
| Module-wise count rates for Quadrant B Data is divided into 100 sec bins |
 |
 |
| Module-wise count rates for Quadrant C Data is divided into 100 sec bins |
 |
 |
| Module-wise count rates for Quadrant D Data is divided into 100 sec bins |
 |
 |
| Parameter | Plot |
|---|---|
| CZT HV Monitor |  |
| D_VDD |  |
| Temperature 1 |  |
| Veto HV Monitor | 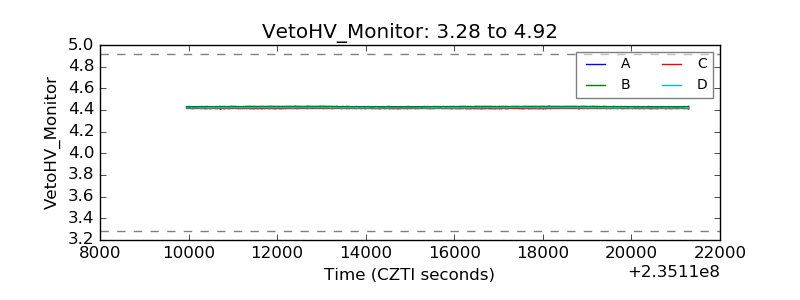 |
| Veto LLD |  |
| Alpha Counter |  |
| _CPM_Rate |  |
| CZT Counter |  |
| +2.5 Volts monitor |  |
| +5 Volts monitor | 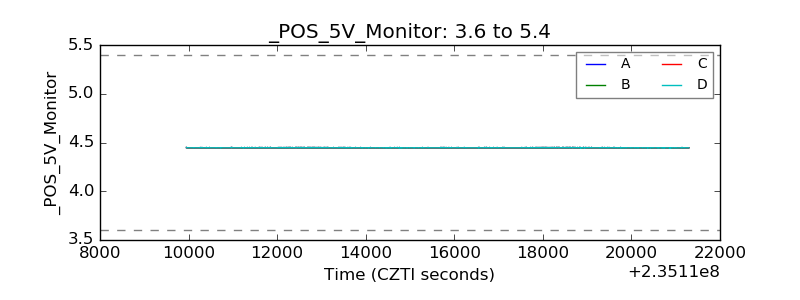 |
| _ROLL_ROT |  |
| _Roll_DEC |  |
| _Roll_RA |  |
| Veto Counter |  |