| Param | Original file | Final file |
|---|---|---|
| Filename | modeM0/AS1A03_091T01_9000001296cztM0_level2.evt | modeM0/AS1A03_091T01_9000001296cztM0_level2_quad_clean.evt |
| Size (bytes) | 672,448,320 | 119,033,280 |
| Size | 641.3 MB | 113.5 MB |
| Events in quadrant A | 6,138,255 | 736,338 |
| Events in quadrant B | 4,510,944 | 751,407 |
| Events in quadrant C | 4,388,016 | 737,129 |
| Events in quadrant D | 4,682,653 | 720,421 |
| Mode M0 | |||
|---|---|---|---|
| Quadrant | BADHDUFLAG | Total packets | Discarded packets |
| A | 0 | 24418 | 0 |
| B | 0 | 19528 | 0 |
| C | 0 | 19573 | 0 |
| D | 0 | 20471 | 0 |
| Mode M9 | |||
|---|---|---|---|
| Quadrant | BADHDUFLAG | Total packets | Discarded packets |
| A | 0 | 11 | 0 |
| B | 0 | 11 | 0 |
| C | 0 | 10 | 0 |
| D | 0 | 10 | 0 |
| Mode SS | |||
|---|---|---|---|
| Quadrant | BADHDUFLAG | Total packets | Discarded packets |
| A | 0 | 190 | 0 |
| B | 0 | 196 | 0 |
| C | 0 | 194 | 0 |
| D | 0 | 194 | 0 |
| Quadrant | Total seconds | Saturated seconds | Saturation percentage |
|---|---|---|---|
| A | 9483 | 252 | 2.657387% |
| B | 9529 | 140 | 1.469199% |
| C | 9542 | 107 | 1.121358% |
| D | 9511 | 147 | 1.545579% |
Noise dominated data is calculated using 1-second bins in cleaned event files. If a bin has >2000 counts, and if more than 50% of those come from <1% of pixels, then it is considered to be noise-dominated and hence unusable.
| Quadrant | # 1 sec bins | Bins with >0 counts | Bins with >2000 counts | High rate bins dominated by noise | Noise dominated (total time) | Noise dominated (detector-on time) | Marked lightcurve |
|---|---|---|---|---|---|---|---|
| A | 10769 | 9694 | 53 | 53 | 0.49% | 0.55% | 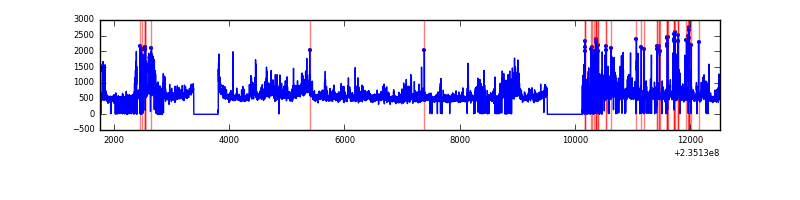 |
| B | 10769 | 9706 | 1 | 1 | 0.01% | 0.01% | 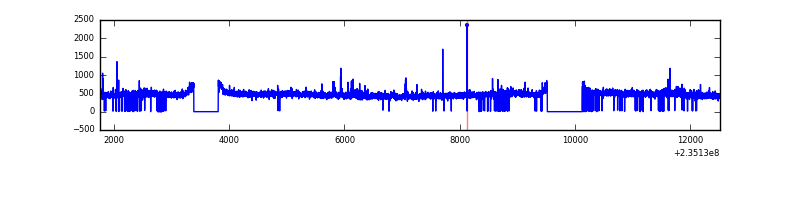 |
| C | 10769 | 9693 | 12 | 12 | 0.11% | 0.12% |  |
| D | 10769 | 9701 | 46 | 46 | 0.43% | 0.47% |  |
Top three noisy pixels from each quadrant. If the there are fewer than three noisy pixels in the level2.evt file, extra rows are filled as -1
| Pixel properties | Quadrant properties | ||||||
|---|---|---|---|---|---|---|---|
| Quadrant | DetID | PixID | Counts | Sigma | Mean | Median | Sigma |
| A | 8 | 5 | 1712572 | 7512.15 | 1121 | 1094 | 227.8 |
| A | 1 | 162 | 48015 | 205.95 | 1121 | 1094 | 227.8 |
| A | 15 | 174 | 23393 | 97.88 | 1121 | 1094 | 227.8 |
| B | 0 | 187 | 25480 | 111.89 | 1137 | 1109 | 217.8 |
| B | 0 | 214 | 25480 | 111.89 | 1137 | 1109 | 217.8 |
| B | 12 | 111 | 24999 | 109.68 | 1137 | 1109 | 217.8 |
| C | 14 | 234 | 67455 | 259.29 | 1104 | 1109 | 255.9 |
| C | 14 | 67 | 9175 | 31.52 | 1104 | 1109 | 255.9 |
| C | 13 | 61 | 8297 | 28.09 | 1104 | 1109 | 255.9 |
| D | 1 | 52 | 235653 | 860.32 | 1093 | 1063 | 272.7 |
| D | 2 | 136 | 153915 | 560.56 | 1093 | 1063 | 272.7 |
| D | 7 | 71 | 57880 | 208.37 | 1093 | 1063 | 272.7 |
Histogram calculated using DETX and DETY for each event in the final _common_clean file
| Quadrant A | 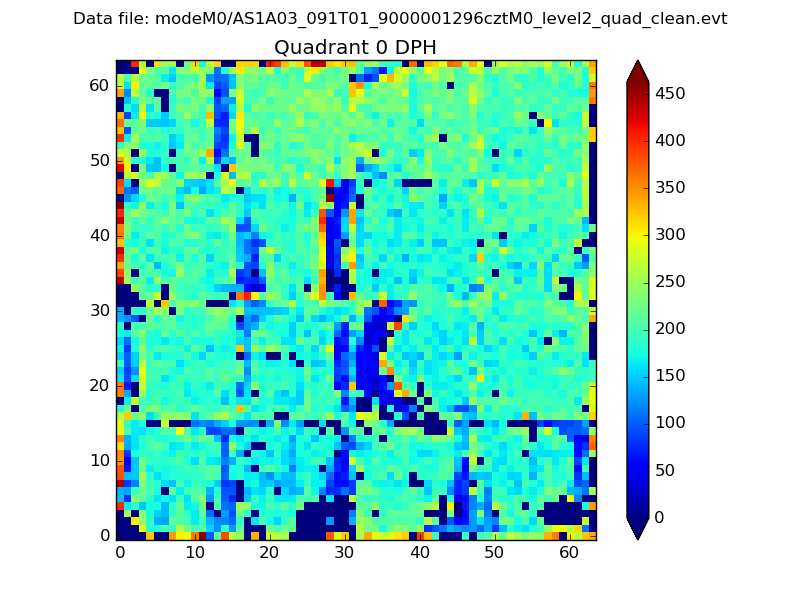 |
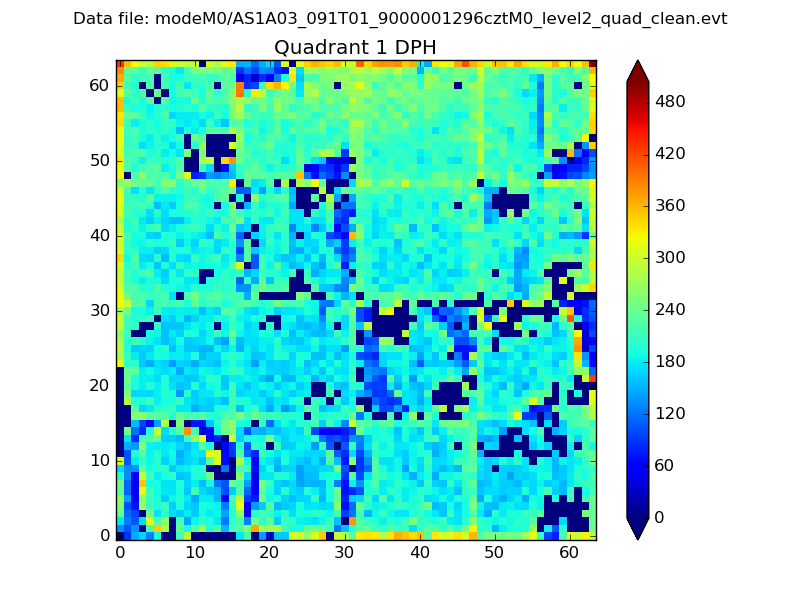 |
Quadrant B |
|---|---|---|---|
| Quadrant D |  |
 |
Quadrant C |
| Plot type | Count rate plots | Images |
|---|---|---|
| Comparison with Poisson distribution Blue bars denote a histogram of data divided into 1 sec bins. Red curve is a Poisson curve with rate = median count rate of data. |
 |
 |
| Quadrant-wise count rates Data is divided into 100 sec bins |
 |
|
| Module-wise count rates for Quadrant A Data is divided into 100 sec bins |
 |
 |
| Module-wise count rates for Quadrant B Data is divided into 100 sec bins |
 |
 |
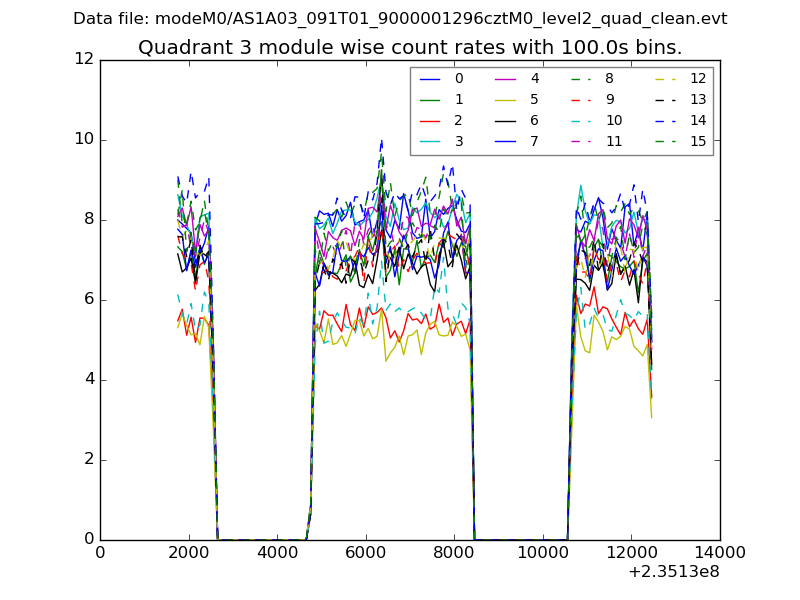
| Module-wise count rates for Quadrant C Data is divided into 100 sec bins |
 |
 |
| Module-wise count rates for Quadrant D Data is divided into 100 sec bins |
 |
 |
| Parameter | Plot |
|---|---|
| CZT HV Monitor |  |
| D_VDD |  |
| Temperature 1 |  |
| Veto HV Monitor |  |
| Veto LLD | 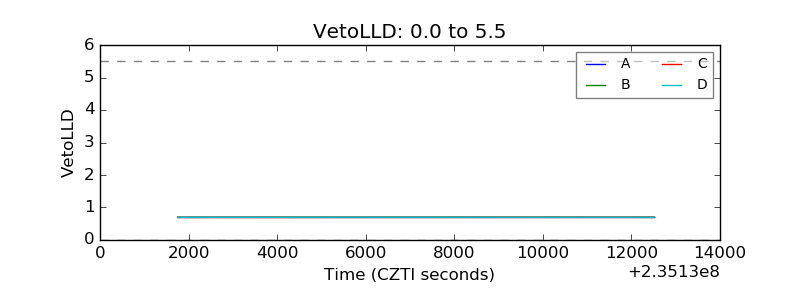 |
| Alpha Counter | 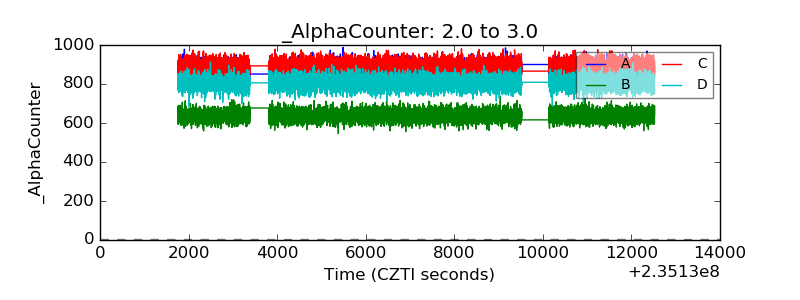 |
| _CPM_Rate |  |
| CZT Counter |  |
| +2.5 Volts monitor |  |
| +5 Volts monitor |  |
| _ROLL_ROT |  |
| _Roll_DEC | 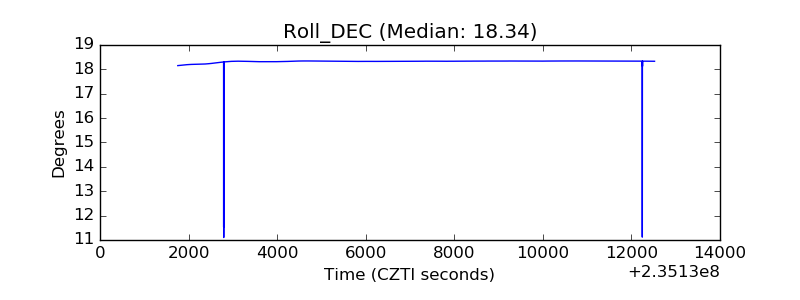 |
| _Roll_RA |  |
| Veto Counter |  |