| Param | Original file | Final file |
|---|---|---|
| Filename | modeM0/AS1A03_062T04_9000001298cztM0_level2.evt | modeM0/AS1A03_062T04_9000001298cztM0_level2_quad_clean.evt |
| Size (bytes) | 1,357,179,840 | 222,845,760 |
| Size | 1.3 GB | 212.5 MB |
| Events in quadrant A | 12,878,542 | 1,355,649 |
| Events in quadrant B | 9,150,629 | 1,395,185 |
| Events in quadrant C | 8,972,124 | 1,367,420 |
| Events in quadrant D | 8,821,828 | 1,326,888 |
| Mode M9 | |||
|---|---|---|---|
| Quadrant | BADHDUFLAG | Total packets | Discarded packets |
| A | 0 | 40 | 0 |
| B | 0 | 38 | 0 |
| C | 0 | 40 | 0 |
| D | 0 | 40 | 0 |
| Mode SS | |||
|---|---|---|---|
| Quadrant | BADHDUFLAG | Total packets | Discarded packets |
| A | 0 | 384 | 0 |
| B | 0 | 388 | 0 |
| C | 0 | 383 | 0 |
| D | 0 | 384 | 0 |
| Mode M0 | |||
|---|---|---|---|
| Quadrant | BADHDUFLAG | Total packets | Discarded packets |
| A | 0 | 51247 | 0 |
| B | 0 | 39875 | 0 |
| C | 0 | 39627 | 0 |
| D | 0 | 39930 | 0 |
| Quadrant | Total seconds | Saturated seconds | Saturation percentage |
|---|---|---|---|
| A | 18876 | 352 | 1.864802% |
| B | 18949 | 188 | 0.992137% |
| C | 18966 | 112 | 0.590530% |
| D | 18948 | 182 | 0.960524% |
Noise dominated data is calculated using 1-second bins in cleaned event files. If a bin has >2000 counts, and if more than 50% of those come from <1% of pixels, then it is considered to be noise-dominated and hence unusable.
| Quadrant | # 1 sec bins | Bins with >0 counts | Bins with >2000 counts | High rate bins dominated by noise | Noise dominated (total time) | Noise dominated (detector-on time) | Marked lightcurve |
|---|---|---|---|---|---|---|---|
| A | 23126 | 19129 | 126 | 126 | 0.54% | 0.66% |  |
| B | 23126 | 19139 | 4 | 4 | 0.02% | 0.02% |  |
| C | 23126 | 19141 | 7 | 7 | 0.03% | 0.04% | 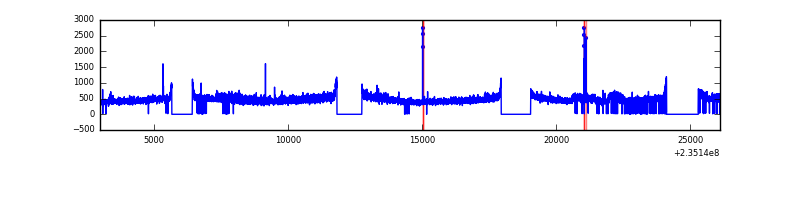 |
| D | 23126 | 19139 | 35 | 35 | 0.15% | 0.18% | 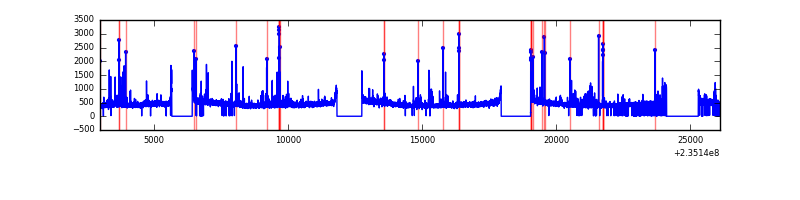 |
Top three noisy pixels from each quadrant. If the there are fewer than three noisy pixels in the level2.evt file, extra rows are filled as -1
| Pixel properties | Quadrant properties | ||||||
|---|---|---|---|---|---|---|---|
| Quadrant | DetID | PixID | Counts | Sigma | Mean | Median | Sigma |
| A | 8 | 5 | 3569302 | 7851.75 | 2225 | 2176 | 454.3 |
| A | 4 | 2 | 289201 | 631.78 | 2225 | 2176 | 454.3 |
| A | 13 | 251 | 134917 | 292.18 | 2225 | 2176 | 454.3 |
| B | 0 | 219 | 134970 | 309.71 | 2261 | 2205 | 428.7 |
| B | 0 | 214 | 87507 | 198.99 | 2261 | 2205 | 428.7 |
| B | 12 | 111 | 47051 | 104.62 | 2261 | 2205 | 428.7 |
| C | 9 | 68 | 375425 | 738.7 | 2190 | 2202 | 505.2 |
| C | 14 | 234 | 45476 | 85.65 | 2190 | 2202 | 505.2 |
| C | 13 | 61 | 16514 | 28.33 | 2190 | 2202 | 505.2 |
| D | 2 | 136 | 256641 | 469.9 | 2166 | 2111 | 541.7 |
| D | 7 | 71 | 117648 | 213.3 | 2166 | 2111 | 541.7 |
| D | 1 | 52 | 94734 | 171.0 | 2166 | 2111 | 541.7 |
Histogram calculated using DETX and DETY for each event in the final _common_clean file
| Quadrant A |  |
 |
Quadrant B |
|---|---|---|---|
| Quadrant D |  |
 |
Quadrant C |
| Plot type | Count rate plots | Images |
|---|---|---|
| Comparison with Poisson distribution Blue bars denote a histogram of data divided into 1 sec bins. Red curve is a Poisson curve with rate = median count rate of data. |
 |
 |
| Quadrant-wise count rates Data is divided into 100 sec bins |
 |
|
| Module-wise count rates for Quadrant A Data is divided into 100 sec bins |
 |
 |
| Module-wise count rates for Quadrant B Data is divided into 100 sec bins |
 |
 |
| Module-wise count rates for Quadrant C Data is divided into 100 sec bins |
 |
 |
| Module-wise count rates for Quadrant D Data is divided into 100 sec bins |
 |
 |
| Parameter | Plot |
|---|---|
| CZT HV Monitor |  |
| D_VDD |  |
| Temperature 1 |  |
| Veto HV Monitor |  |
| Veto LLD |  |
| Alpha Counter |  |
| _CPM_Rate |  |
| CZT Counter |  |
| +2.5 Volts monitor |  |
| +5 Volts monitor |  |
| _ROLL_ROT |  |
| _Roll_DEC |  |
| _Roll_RA | 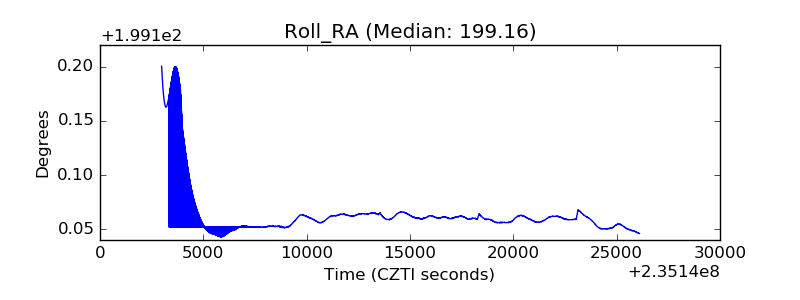 |
| Veto Counter |  |