| Param | Original file | Final file |
|---|---|---|
| Filename | modeM0/AS1A03_051T01_9000001288cztM0_level2_bc.evt | modeM0/AS1A03_051T01_9000001288cztM0_level2_quad_clean.evt |
| Size (bytes) | 2,461,020,480 | 829,572,480 |
| Size | 2.3 GB | 791.1 MB |
| Events in quadrant A | 21,616,140 | 5,132,400 |
| Events in quadrant B | 17,464,530 | 5,187,920 |
| Events in quadrant C | 13,396,585 | 5,096,452 |
| Events in quadrant D | 17,324,580 | 4,952,681 |
| Mode SS | |||
|---|---|---|---|
| Quadrant | BADHDUFLAG | Total packets | Discarded packets |
| A | 0 | 1412 | 0 |
| B | 0 | 1428 | 0 |
| C | 0 | 1410 | 0 |
| D | 0 | 1412 | 0 |
| Mode M0 | |||
|---|---|---|---|
| Quadrant | BADHDUFLAG | Total packets | Discarded packets |
| A | 0 | 172051 | 0 |
| B | 0 | 155108 | 0 |
| C | 0 | 142060 | 0 |
| D | 0 | 152879 | 0 |
| Mode M9 | |||
|---|---|---|---|
| Quadrant | BADHDUFLAG | Total packets | Discarded packets |
| A | 0 | 112 | 0 |
| B | 0 | 112 | 0 |
| C | 0 | 110 | 0 |
| D | 0 | 112 | 0 |
| Quadrant | Total seconds | Saturated seconds | Saturation percentage |
|---|---|---|---|
| A | 69224 | 2035 | 2.939732% |
| B | 69380 | 1739 | 2.506486% |
| C | 69429 | 619 | 0.891558% |
| D | 69307 | 1037 | 1.496241% |
Noise dominated data is calculated using 1-second bins in cleaned event files. If a bin has >2000 counts, and if more than 50% of those come from <1% of pixels, then it is considered to be noise-dominated and hence unusable.
| Quadrant | # 1 sec bins | Bins with >0 counts | Bins with >2000 counts | High rate bins dominated by noise | Noise dominated (total time) | Noise dominated (detector-on time) | Marked lightcurve |
|---|---|---|---|---|---|---|---|
| A | 82364 | 70572 | 19 | 19 | 0.02% | 0.03% |  |
| B | 82364 | 70686 | 285 | 285 | 0.35% | 0.40% |  |
| C | 82363 | 70688 | 1 | 1 | 0.00% | 0.00% |  |
| D | 82364 | 70640 | 52 | 52 | 0.06% | 0.07% |  |
Top three noisy pixels from each quadrant. If the there are fewer than three noisy pixels in the level2.evt file, extra rows are filled as -1
| Pixel properties | Quadrant properties | ||||||
|---|---|---|---|---|---|---|---|
| Quadrant | DetID | PixID | Counts | Sigma | Mean | Median | Sigma |
| A | 8 | 5 | 5928660 | 7815.87 | 3455 | 3385 | 758.1 |
| A | 15 | 174 | 849973 | 1116.71 | 3455 | 3385 | 758.1 |
| A | 1 | 162 | 585680 | 768.09 | 3455 | 3385 | 758.1 |
| B | 6 | 51 | 1900836 | 2836.75 | 3498 | 3396 | 668.9 |
| B | 8 | 234 | 410014 | 607.91 | 3498 | 3396 | 668.9 |
| B | 0 | 214 | 381235 | 564.88 | 3498 | 3396 | 668.9 |
| C | 12 | 4 | 46569 | 58.61 | 3384 | 3324 | 737.8 |
| C | 14 | 67 | 42143 | 52.61 | 3384 | 3324 | 737.8 |
| C | 8 | 222 | 39421 | 48.92 | 3384 | 3324 | 737.8 |
| D | 1 | 52 | 1920775 | 2177.44 | 3392 | 3280 | 880.6 |
| D | 7 | 71 | 761802 | 861.35 | 3392 | 3280 | 880.6 |
| D | 12 | 233 | 374294 | 421.31 | 3392 | 3280 | 880.6 |
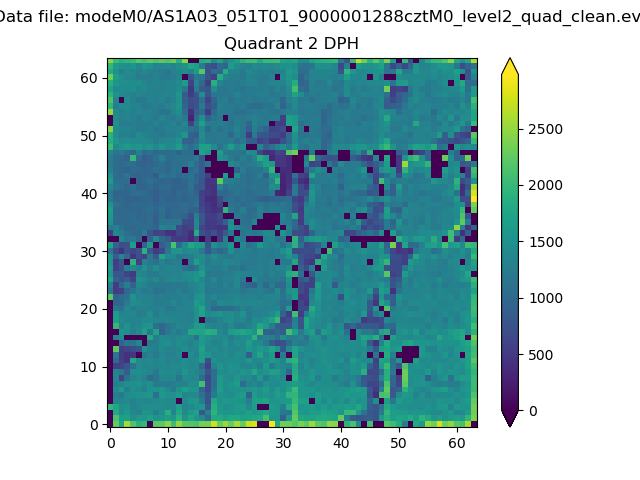
Histogram calculated using DETX and DETY for each event in the final _common_clean file
| Quadrant A |  |
 |
Quadrant B |
|---|---|---|---|
| Quadrant D |  |
 |
Quadrant C |
| Plot type | Count rate plots | Images |
|---|---|---|
| Comparison with Poisson distribution Blue bars denote a histogram of data divided into 1 sec bins. Red curve is a Poisson curve with rate = median count rate of data. |
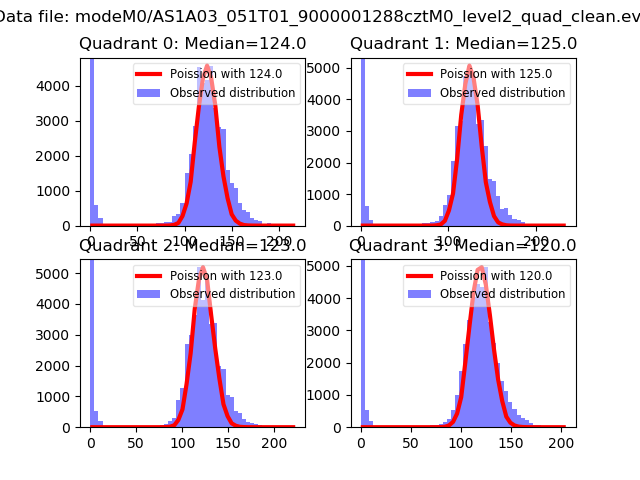 |
 |
| Quadrant-wise count rates Data is divided into 100 sec bins |
 |
|
| Module-wise count rates for Quadrant A Data is divided into 100 sec bins |
 |
 |
| Module-wise count rates for Quadrant B Data is divided into 100 sec bins |
 |
 |
| Module-wise count rates for Quadrant C Data is divided into 100 sec bins |
 |
 |
| Module-wise count rates for Quadrant D Data is divided into 100 sec bins |
 |
 |
| Parameter | Plot |
|---|---|
| CZT HV Monitor |  |
| D_VDD |  |
| Temperature 1 |  |
| Veto HV Monitor |  |
| Veto LLD | 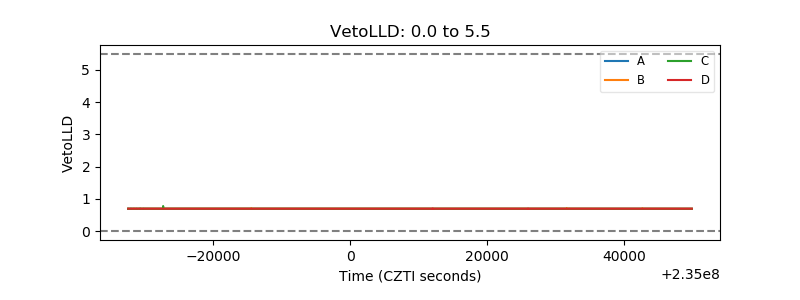 |
| Alpha Counter |  |
| _CPM_Rate |  |
| CZT Counter | 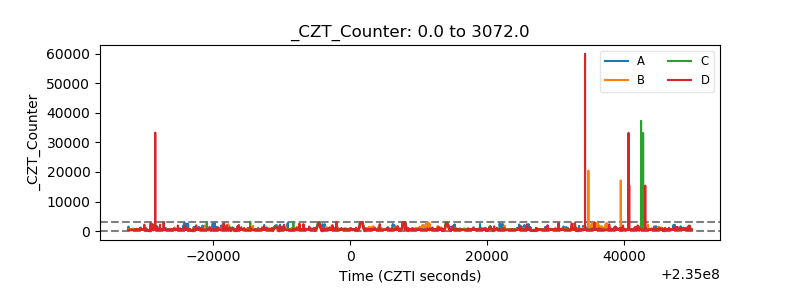 |
| +2.5 Volts monitor |  |
| +5 Volts monitor |  |
| _ROLL_ROT |  |
| _Roll_DEC |  |
| _Roll_RA | 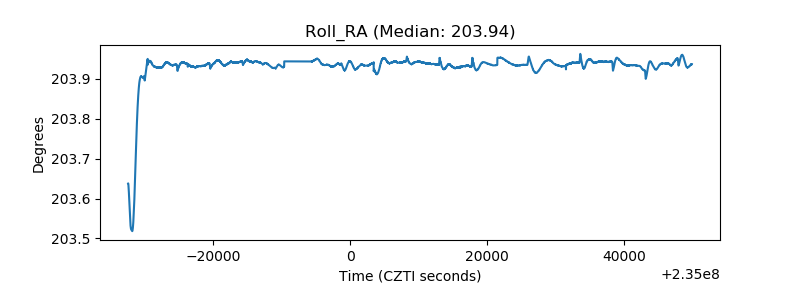 |
| Veto Counter |  |