| Param | Original file | Final file |
|---|---|---|
| Filename | modeM0/AS1C02_042T01_9000001278cztM0_level2.evt | modeM0/AS1C02_042T01_9000001278cztM0_level2_quad_clean.evt |
| Size (bytes) | 5,561,553,600 | 1,153,146,240 |
| Size | 5.2 GB | 1.1 GB |
| Events in quadrant A | 45,431,071 | 7,356,454 |
| Events in quadrant B | 38,570,430 | 7,513,289 |
| Events in quadrant C | 36,434,017 | 7,413,683 |
| Events in quadrant D | 42,482,006 | 7,045,288 |
| Mode M0 | |||
|---|---|---|---|
| Quadrant | BADHDUFLAG | Total packets | Discarded packets |
| A | 0 | 188310 | 0 |
| B | 0 | 170396 | 0 |
| C | 0 | 167026 | 0 |
| D | 0 | 185163 | 0 |
| Mode M9 | |||
|---|---|---|---|
| Quadrant | BADHDUFLAG | Total packets | Discarded packets |
| A | 0 | 147 | 0 |
| B | 0 | 146 | 0 |
| C | 0 | 145 | 0 |
| D | 0 | 145 | 0 |
| Mode SS | |||
|---|---|---|---|
| Quadrant | BADHDUFLAG | Total packets | Discarded packets |
| A | 0 | 1640 | 0 |
| B | 0 | 1666 | 0 |
| C | 0 | 1658 | 0 |
| D | 0 | 1659 | 0 |
| Quadrant | Total seconds | Saturated seconds | Saturation percentage |
|---|---|---|---|
| A | 81691 | 1216 | 1.488536% |
| B | 81804 | 1056 | 1.290890% |
| C | 81745 | 697 | 0.852652% |
| D | 81598 | 2089 | 2.560112% |
Noise dominated data is calculated using 1-second bins in cleaned event files. If a bin has >2000 counts, and if more than 50% of those come from <1% of pixels, then it is considered to be noise-dominated and hence unusable.
| Quadrant | # 1 sec bins | Bins with >0 counts | Bins with >2000 counts | High rate bins dominated by noise | Noise dominated (total time) | Noise dominated (detector-on time) | Marked lightcurve |
|---|---|---|---|---|---|---|---|
| A | 97612 | 82795 | 101 | 101 | 0.10% | 0.12% |  |
| B | 97612 | 82849 | 71 | 71 | 0.07% | 0.09% |  |
| C | 97612 | 82786 | 2 | 2 | 0.00% | 0.00% |  |
| D | 97612 | 82691 | 1329 | 1329 | 1.36% | 1.61% |  |
Top three noisy pixels from each quadrant. If the there are fewer than three noisy pixels in the level2.evt file, extra rows are filled as -1
| Pixel properties | Quadrant properties | ||||||
|---|---|---|---|---|---|---|---|
| Quadrant | DetID | PixID | Counts | Sigma | Mean | Median | Sigma |
| A | 8 | 5 | 7603840 | 4007.67 | 9455 | 9251 | 1895.0 |
| A | 1 | 162 | 639811 | 332.75 | 9455 | 9251 | 1895.0 |
| A | 5 | 16 | 216925 | 109.59 | 9455 | 9251 | 1895.0 |
| B | 8 | 234 | 315594 | 172.67 | 9570 | 9341 | 1773.6 |
| B | 0 | 219 | 286655 | 156.36 | 9570 | 9341 | 1773.6 |
| B | 0 | 214 | 231495 | 125.26 | 9570 | 9341 | 1773.6 |
| C | 13 | 61 | 70769 | 29.09 | 9278 | 9316 | 2112.7 |
| C | 9 | 68 | 69140 | 28.32 | 9278 | 9316 | 2112.7 |
| C | 4 | 239 | 51292 | 19.87 | 9278 | 9316 | 2112.7 |
| D | 1 | 52 | 4543481 | 1889.37 | 9089 | 8888 | 2400.1 |
| D | 2 | 14 | 1170822 | 484.13 | 9089 | 8888 | 2400.1 |
| D | 7 | 71 | 683192 | 280.95 | 9089 | 8888 | 2400.1 |
Histogram calculated using DETX and DETY for each event in the final _common_clean file
| Quadrant A |  |
 |
Quadrant B |
|---|---|---|---|
| Quadrant D |  |
 |
Quadrant C |
| Plot type | Count rate plots | Images |
|---|---|---|
| Comparison with Poisson distribution Blue bars denote a histogram of data divided into 1 sec bins. Red curve is a Poisson curve with rate = median count rate of data. |
 |
 |
| Quadrant-wise count rates Data is divided into 100 sec bins |
 |
|
| Module-wise count rates for Quadrant A Data is divided into 100 sec bins |
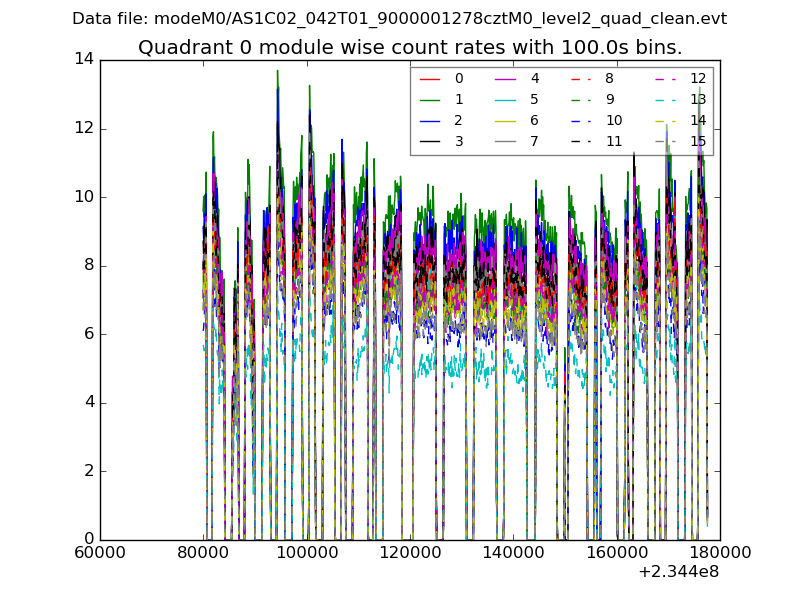 |
 |
| Module-wise count rates for Quadrant B Data is divided into 100 sec bins |
 |
 |
| Module-wise count rates for Quadrant C Data is divided into 100 sec bins |
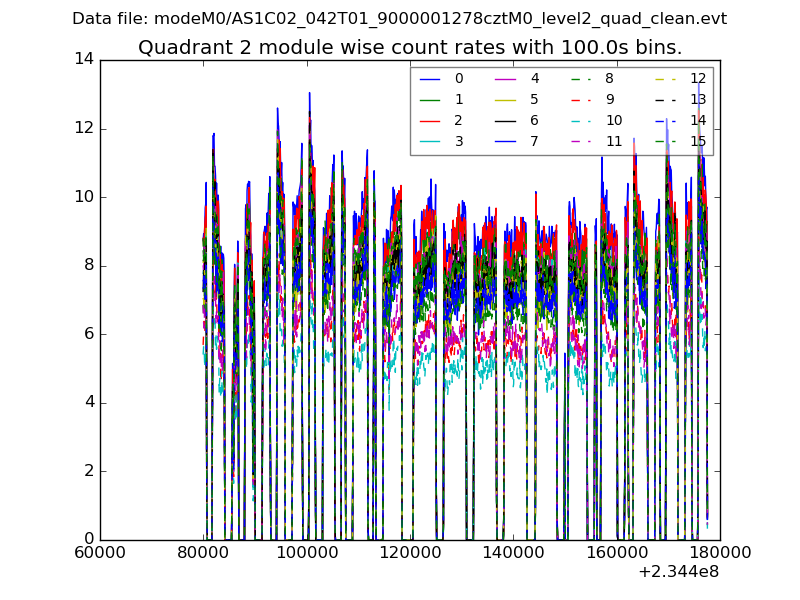 |
 |
| Module-wise count rates for Quadrant D Data is divided into 100 sec bins |
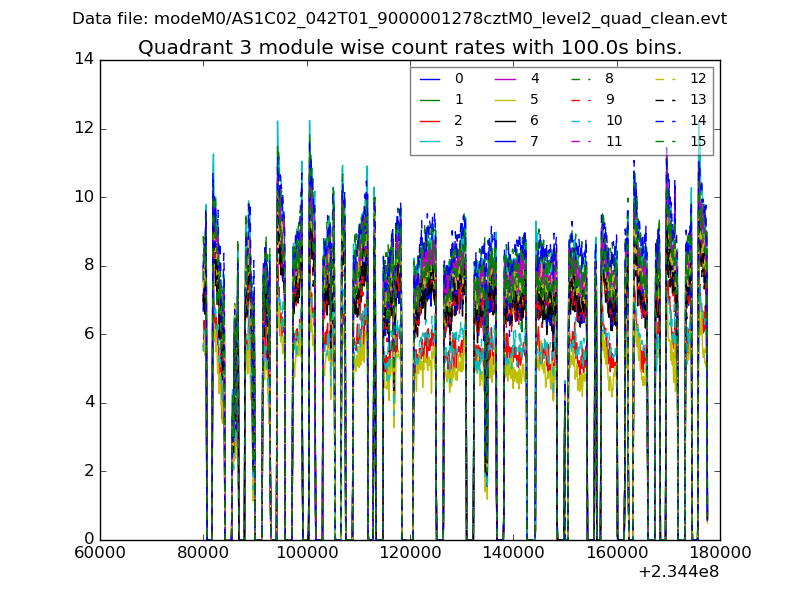 |
 |
| Parameter | Plot |
|---|---|
| CZT HV Monitor |  |
| D_VDD |  |
| Temperature 1 |  |
| Veto HV Monitor |  |
| Veto LLD |  |
| Alpha Counter |  |
| _CPM_Rate |  |
| CZT Counter |  |
| +2.5 Volts monitor |  |
| +5 Volts monitor |  |
| _ROLL_ROT |  |
| _Roll_DEC |  |
| _Roll_RA |  |
| Veto Counter |  |