| Param | Original file | Final file |
|---|---|---|
| Filename | modeM0/AS1A03_033T01_9000001276cztM0_level2.evt | modeM0/AS1A03_033T01_9000001276cztM0_level2_quad_clean.evt |
| Size (bytes) | 1,276,603,200 | 226,897,920 |
| Size | 1.2 GB | 216.4 MB |
| Events in quadrant A | 10,264,143 | 1,439,280 |
| Events in quadrant B | 8,334,042 | 1,441,970 |
| Events in quadrant C | 7,624,183 | 1,422,050 |
| Events in quadrant D | 11,260,790 | 1,366,216 |
| Mode SS | |||
|---|---|---|---|
| Quadrant | BADHDUFLAG | Total packets | Discarded packets |
| A | 0 | 352 | 0 |
| B | 0 | 352 | 0 |
| C | 0 | 352 | 0 |
| D | 0 | 352 | 0 |
| Mode M9 | |||
|---|---|---|---|
| Quadrant | BADHDUFLAG | Total packets | Discarded packets |
| A | 0 | 25 | 0 |
| B | 0 | 25 | 0 |
| C | 0 | 25 | 0 |
| D | 0 | 25 | 0 |
| Mode M0 | |||
|---|---|---|---|
| Quadrant | BADHDUFLAG | Total packets | Discarded packets |
| A | 0 | 42118 | 0 |
| B | 0 | 36839 | 0 |
| C | 0 | 35508 | 0 |
| D | 0 | 46068 | 0 |
| Quadrant | Total seconds | Saturated seconds | Saturation percentage |
|---|---|---|---|
| A | 17448 | 259 | 1.484411% |
| B | 17453 | 177 | 1.014152% |
| C | 17454 | 123 | 0.704710% |
| D | 17453 | 1159 | 6.640692% |
Noise dominated data is calculated using 1-second bins in cleaned event files. If a bin has >2000 counts, and if more than 50% of those come from <1% of pixels, then it is considered to be noise-dominated and hence unusable.
| Quadrant | # 1 sec bins | Bins with >0 counts | Bins with >2000 counts | High rate bins dominated by noise | Noise dominated (total time) | Noise dominated (detector-on time) | Marked lightcurve |
|---|---|---|---|---|---|---|---|
| A | 19776 | 17456 | 55 | 55 | 0.28% | 0.32% |  |
| B | 19776 | 17456 | 11 | 11 | 0.06% | 0.06% |  |
| C | 19776 | 17456 | 6 | 6 | 0.03% | 0.03% |  |
| D | 19776 | 17454 | 1065 | 1065 | 5.39% | 6.10% |  |
Top three noisy pixels from each quadrant. If the there are fewer than three noisy pixels in the level2.evt file, extra rows are filled as -1
| Pixel properties | Quadrant properties | ||||||
|---|---|---|---|---|---|---|---|
| Quadrant | DetID | PixID | Counts | Sigma | Mean | Median | Sigma |
| A | 8 | 5 | 2149870 | 5422.7 | 1982 | 1942 | 396.1 |
| A | 13 | 251 | 168559 | 420.64 | 1982 | 1942 | 396.1 |
| A | 1 | 162 | 150653 | 375.44 | 1982 | 1942 | 396.1 |
| B | 4 | 48 | 248986 | 656.16 | 1996 | 1951 | 376.5 |
| B | 0 | 230 | 57597 | 147.8 | 1996 | 1951 | 376.5 |
| B | 0 | 219 | 52423 | 134.06 | 1996 | 1951 | 376.5 |
| C | 14 | 234 | 55876 | 121.24 | 1928 | 1933 | 444.9 |
| C | 9 | 68 | 41335 | 88.56 | 1928 | 1933 | 444.9 |
| C | 13 | 61 | 14618 | 28.51 | 1928 | 1933 | 444.9 |
| D | 12 | 233 | 2816775 | 5551.19 | 1893 | 1849 | 507.1 |
| D | 2 | 14 | 555981 | 1092.78 | 1893 | 1849 | 507.1 |
| D | 1 | 52 | 272529 | 533.8 | 1893 | 1849 | 507.1 |
Histogram calculated using DETX and DETY for each event in the final _common_clean file
| Quadrant A | 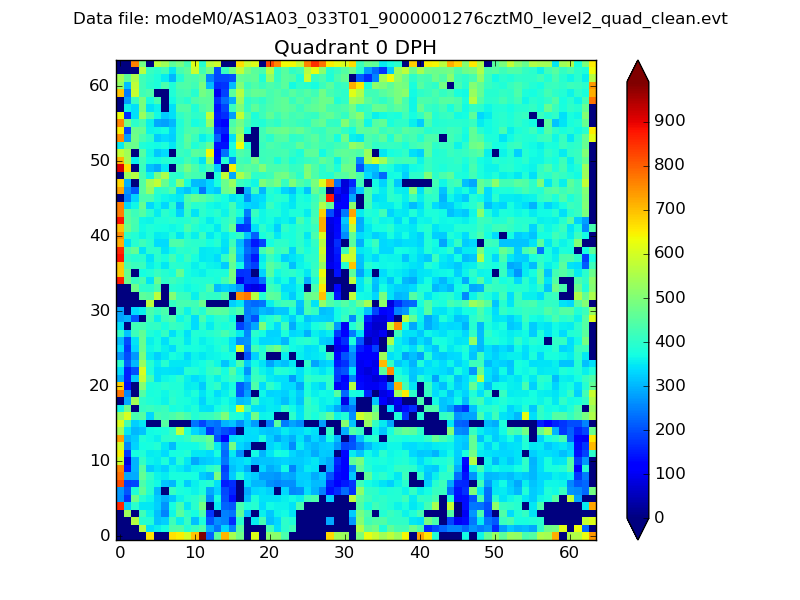 |
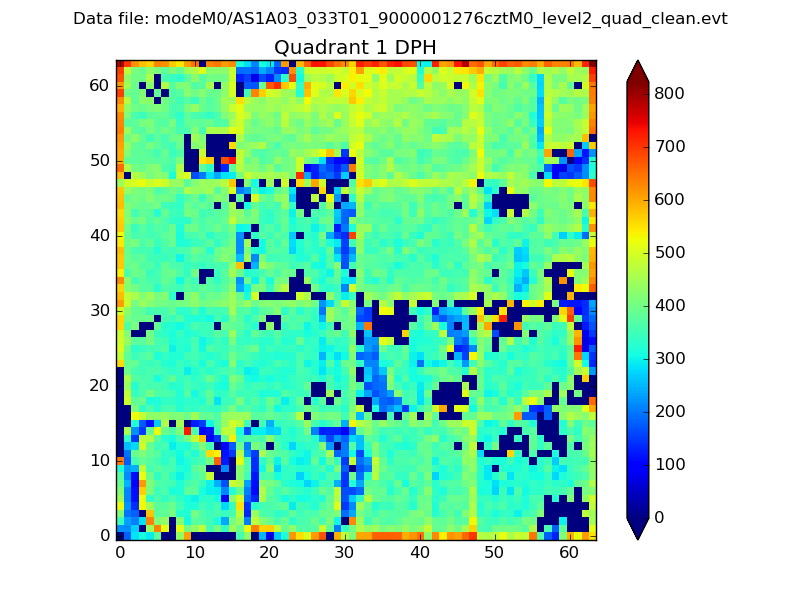 |
Quadrant B |
|---|---|---|---|
| Quadrant D |  |
 |
Quadrant C |
| Plot type | Count rate plots | Images |
|---|---|---|
| Comparison with Poisson distribution Blue bars denote a histogram of data divided into 1 sec bins. Red curve is a Poisson curve with rate = median count rate of data. |
 |
 |
| Quadrant-wise count rates Data is divided into 100 sec bins |
 |
|
| Module-wise count rates for Quadrant A Data is divided into 100 sec bins |
 |
 |
| Module-wise count rates for Quadrant B Data is divided into 100 sec bins |
 |
 |
| Module-wise count rates for Quadrant C Data is divided into 100 sec bins |
 |
 |
| Module-wise count rates for Quadrant D Data is divided into 100 sec bins |
 |
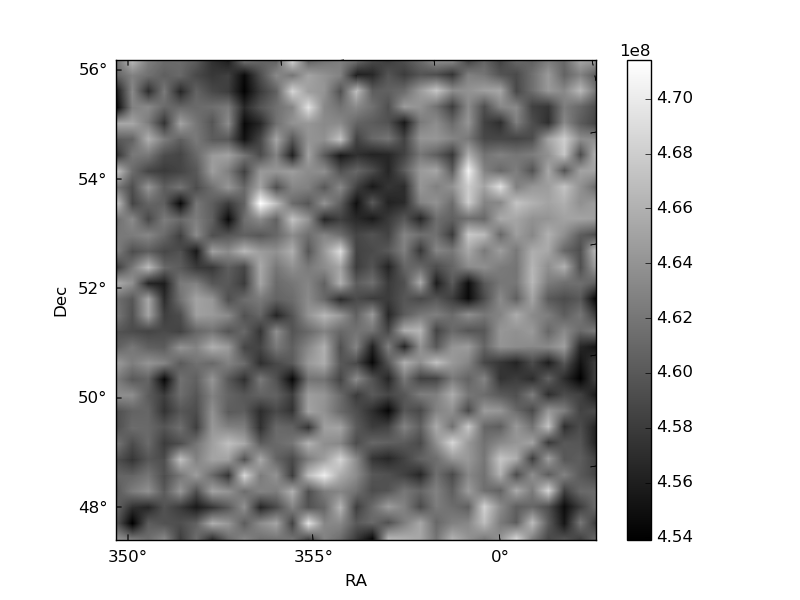 |
| Parameter | Plot |
|---|---|
| CZT HV Monitor |  |
| D_VDD |  |
| Temperature 1 |  |
| Veto HV Monitor |  |
| Veto LLD |  |
| Alpha Counter |  |
| _CPM_Rate |  |
| CZT Counter |  |
| +2.5 Volts monitor |  |
| +5 Volts monitor |  |
| _ROLL_ROT |  |
| _Roll_DEC |  |
| _Roll_RA |  |
| Veto Counter |  |