| Param | Original file | Final file |
|---|---|---|
| Filename | modeM0/AS1G07_052T01_9000001270cztM0_level2.evt | modeM0/AS1G07_052T01_9000001270cztM0_level2_quad_clean.evt |
| Size (bytes) | 1,128,084,480 | 203,889,600 |
| Size | 1.1 GB | 194.4 MB |
| Events in quadrant A | 9,706,236 | 1,288,626 |
| Events in quadrant B | 7,523,318 | 1,294,931 |
| Events in quadrant C | 7,278,293 | 1,262,526 |
| Events in quadrant D | 8,580,874 | 1,232,291 |
| Mode M9 | |||
|---|---|---|---|
| Quadrant | BADHDUFLAG | Total packets | Discarded packets |
| A | 0 | 16 | 0 |
| B | 0 | 16 | 0 |
| C | 0 | 16 | 0 |
| D | 0 | 16 | 0 |
| Mode M0 | |||
|---|---|---|---|
| Quadrant | BADHDUFLAG | Total packets | Discarded packets |
| A | 0 | 39012 | 0 |
| B | 0 | 32793 | 0 |
| C | 0 | 32681 | 0 |
| D | 0 | 36611 | 0 |
| Mode SS | |||
|---|---|---|---|
| Quadrant | BADHDUFLAG | Total packets | Discarded packets |
| A | 0 | 322 | 0 |
| B | 0 | 324 | 0 |
| C | 0 | 324 | 0 |
| D | 0 | 324 | 0 |
| Quadrant | Total seconds | Saturated seconds | Saturation percentage |
|---|---|---|---|
| A | 15910 | 307 | 1.929604% |
| B | 15904 | 175 | 1.100352% |
| C | 15907 | 153 | 0.961841% |
| D | 15905 | 446 | 2.804150% |
Noise dominated data is calculated using 1-second bins in cleaned event files. If a bin has >2000 counts, and if more than 50% of those come from <1% of pixels, then it is considered to be noise-dominated and hence unusable.
| Quadrant | # 1 sec bins | Bins with >0 counts | Bins with >2000 counts | High rate bins dominated by noise | Noise dominated (total time) | Noise dominated (detector-on time) | Marked lightcurve |
|---|---|---|---|---|---|---|---|
| A | 17505 | 15915 | 107 | 107 | 0.61% | 0.67% |  |
| B | 17505 | 15915 | 5 | 5 | 0.03% | 0.03% |  |
| C | 17505 | 15915 | 21 | 21 | 0.12% | 0.13% |  |
| D | 17505 | 15915 | 335 | 335 | 1.91% | 2.10% |  |
Top three noisy pixels from each quadrant. If the there are fewer than three noisy pixels in the level2.evt file, extra rows are filled as -1
| Pixel properties | Quadrant properties | ||||||
|---|---|---|---|---|---|---|---|
| Quadrant | DetID | PixID | Counts | Sigma | Mean | Median | Sigma |
| A | 8 | 5 | 1685843 | 4491.6 | 1871 | 1838 | 374.9 |
| A | 15 | 223 | 325782 | 864.03 | 1871 | 1838 | 374.9 |
| A | 1 | 162 | 144299 | 379.97 | 1871 | 1838 | 374.9 |
| B | 0 | 214 | 143289 | 391.61 | 1880 | 1831 | 361.2 |
| B | 10 | 16 | 63055 | 169.49 | 1880 | 1831 | 361.2 |
| B | 12 | 111 | 40853 | 108.03 | 1880 | 1831 | 361.2 |
| C | 9 | 68 | 102475 | 238.83 | 1813 | 1819 | 421.5 |
| C | 14 | 234 | 89689 | 208.49 | 1813 | 1819 | 421.5 |
| C | 13 | 61 | 13723 | 28.24 | 1813 | 1819 | 421.5 |
| D | 1 | 52 | 1545866 | 3383.08 | 1800 | 1751 | 456.4 |
| D | 7 | 71 | 84923 | 182.23 | 1800 | 1751 | 456.4 |
| D | 2 | 234 | 65201 | 139.02 | 1800 | 1751 | 456.4 |
Histogram calculated using DETX and DETY for each event in the final _common_clean file
| Quadrant A |  |
 |
Quadrant B |
|---|---|---|---|
| Quadrant D |  |
 |
Quadrant C |
| Plot type | Count rate plots | Images |
|---|---|---|
| Comparison with Poisson distribution Blue bars denote a histogram of data divided into 1 sec bins. Red curve is a Poisson curve with rate = median count rate of data. |
 |
 |
| Quadrant-wise count rates Data is divided into 100 sec bins |
 |
|
| Module-wise count rates for Quadrant A Data is divided into 100 sec bins |
 |
 |
| Module-wise count rates for Quadrant B Data is divided into 100 sec bins |
 |
 |
| Module-wise count rates for Quadrant C Data is divided into 100 sec bins |
 |
 |
| Module-wise count rates for Quadrant D Data is divided into 100 sec bins |
 |
 |
| Parameter | Plot |
|---|---|
| CZT HV Monitor |  |
| D_VDD |  |
| Temperature 1 |  |
| Veto HV Monitor |  |
| Veto LLD | 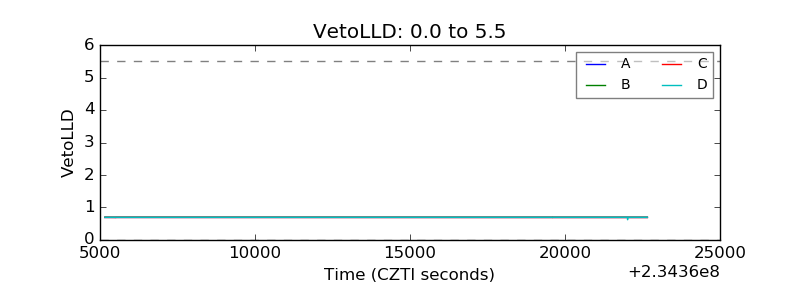 |
| Alpha Counter |  |
| _CPM_Rate |  |
| CZT Counter |  |
| +2.5 Volts monitor |  |
| +5 Volts monitor |  |
| _ROLL_ROT |  |
| _Roll_DEC |  |
| _Roll_RA |  |
| Veto Counter |  |