| Param | Original file | Final file |
|---|---|---|
| Filename | modeM0/AS1G07_046T01_9000001274cztM0_level2.evt | modeM0/AS1G07_046T01_9000001274cztM0_level2_quad_clean.evt |
| Size (bytes) | 3,396,744,000 | 565,678,080 |
| Size | 3.2 GB | 539.5 MB |
| Events in quadrant A | 29,571,497 | 3,472,894 |
| Events in quadrant B | 23,664,489 | 3,550,220 |
| Events in quadrant C | 22,719,323 | 3,431,227 |
| Events in quadrant D | 23,660,102 | 3,368,303 |
| Mode SS | |||
|---|---|---|---|
| Quadrant | BADHDUFLAG | Total packets | Discarded packets |
| A | 0 | 982 | 0 |
| B | 0 | 986 | 0 |
| C | 0 | 986 | 0 |
| D | 0 | 982 | 0 |
| Mode M0 | |||
|---|---|---|---|
| Quadrant | BADHDUFLAG | Total packets | Discarded packets |
| A | 0 | 118181 | 0 |
| B | 0 | 100743 | 0 |
| C | 0 | 100499 | 0 |
| D | 0 | 103544 | 0 |
| Mode M9 | |||
|---|---|---|---|
| Quadrant | BADHDUFLAG | Total packets | Discarded packets |
| A | 0 | 74 | 0 |
| B | 0 | 74 | 0 |
| C | 0 | 74 | 0 |
| D | 0 | 74 | 0 |
| Quadrant | Total seconds | Saturated seconds | Saturation percentage |
|---|---|---|---|
| A | 48116 | 1249 | 2.595810% |
| B | 48271 | 933 | 1.932838% |
| C | 48274 | 589 | 1.220118% |
| D | 48270 | 761 | 1.576549% |
Noise dominated data is calculated using 1-second bins in cleaned event files. If a bin has >2000 counts, and if more than 50% of those come from <1% of pixels, then it is considered to be noise-dominated and hence unusable.
| Quadrant | # 1 sec bins | Bins with >0 counts | Bins with >2000 counts | High rate bins dominated by noise | Noise dominated (total time) | Noise dominated (detector-on time) | Marked lightcurve |
|---|---|---|---|---|---|---|---|
| A | 56153 | 48566 | 279 | 279 | 0.50% | 0.57% | 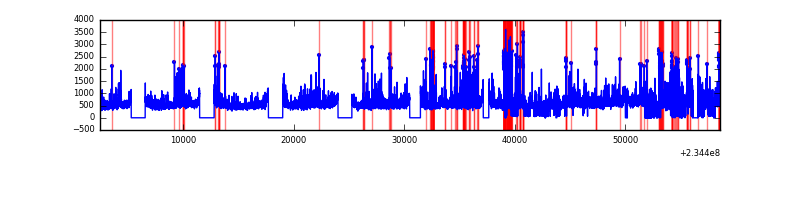 |
| B | 56153 | 48645 | 8 | 8 | 0.01% | 0.02% | 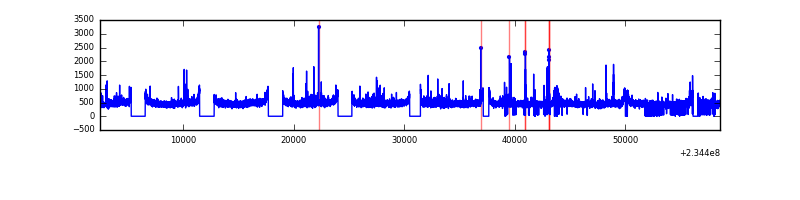 |
| C | 56153 | 48643 | 8 | 8 | 0.01% | 0.02% |  |
| D | 56153 | 48633 | 150 | 150 | 0.27% | 0.31% | 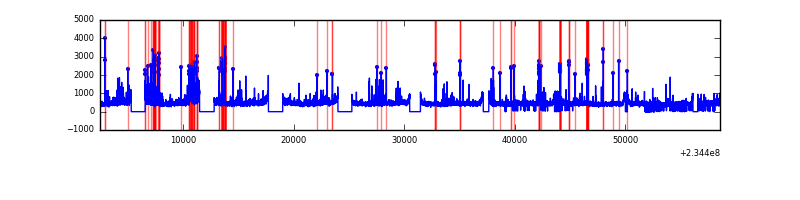 |
Top three noisy pixels from each quadrant. If the there are fewer than three noisy pixels in the level2.evt file, extra rows are filled as -1
| Pixel properties | Quadrant properties | ||||||
|---|---|---|---|---|---|---|---|
| Quadrant | DetID | PixID | Counts | Sigma | Mean | Median | Sigma |
| A | 8 | 5 | 4156214 | 3504.94 | 5920 | 5811 | 1184.2 |
| A | 15 | 236 | 683087 | 571.95 | 5920 | 5811 | 1184.2 |
| A | 15 | 223 | 498542 | 416.1 | 5920 | 5811 | 1184.2 |
| B | 0 | 214 | 461586 | 402.81 | 5957 | 5812 | 1131.5 |
| B | 12 | 111 | 130418 | 110.13 | 5957 | 5812 | 1131.5 |
| B | 11 | 111 | 105912 | 88.47 | 5957 | 5812 | 1131.5 |
| C | 9 | 68 | 206804 | 151.07 | 5731 | 5758 | 1330.8 |
| C | 14 | 234 | 108950 | 77.54 | 5731 | 5758 | 1330.8 |
| C | 13 | 61 | 43271 | 28.19 | 5731 | 5758 | 1330.8 |
| D | 1 | 52 | 1128672 | 803.87 | 5761 | 5624 | 1397.1 |
| D | 2 | 14 | 213304 | 148.66 | 5761 | 5624 | 1397.1 |
| D | 7 | 71 | 193669 | 134.6 | 5761 | 5624 | 1397.1 |
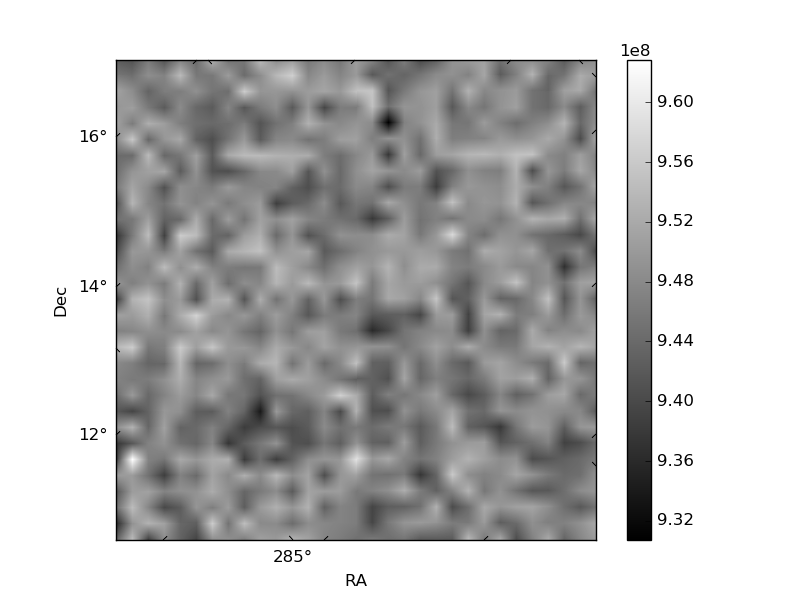
Histogram calculated using DETX and DETY for each event in the final _common_clean file
| Quadrant A |  |
 |
Quadrant B |
|---|---|---|---|
| Quadrant D |  |
 |
Quadrant C |
| Plot type | Count rate plots | Images |
|---|---|---|
| Comparison with Poisson distribution Blue bars denote a histogram of data divided into 1 sec bins. Red curve is a Poisson curve with rate = median count rate of data. |
 |
 |
| Quadrant-wise count rates Data is divided into 100 sec bins |
 |
|
| Module-wise count rates for Quadrant A Data is divided into 100 sec bins |
 |
 |
| Module-wise count rates for Quadrant B Data is divided into 100 sec bins |
 |
 |
| Module-wise count rates for Quadrant C Data is divided into 100 sec bins |
 |
 |
| Module-wise count rates for Quadrant D Data is divided into 100 sec bins |
 |
 |
| Parameter | Plot |
|---|---|
| CZT HV Monitor |  |
| D_VDD |  |
| Temperature 1 |  |
| Veto HV Monitor |  |
| Veto LLD | 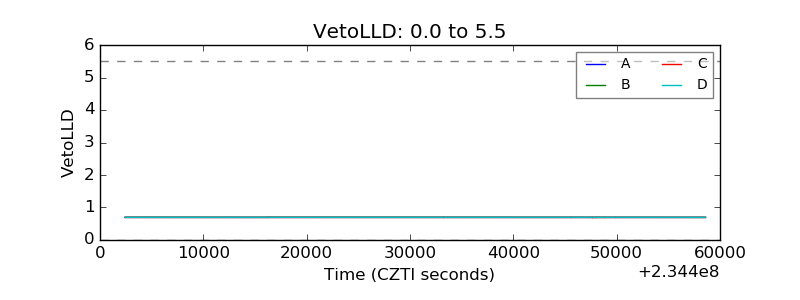 |
| Alpha Counter |  |
| _CPM_Rate |  |
| CZT Counter |  |
| +2.5 Volts monitor | 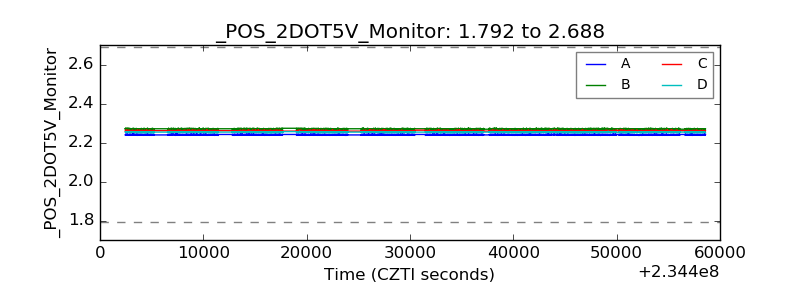 |
| +5 Volts monitor |  |
| _ROLL_ROT | 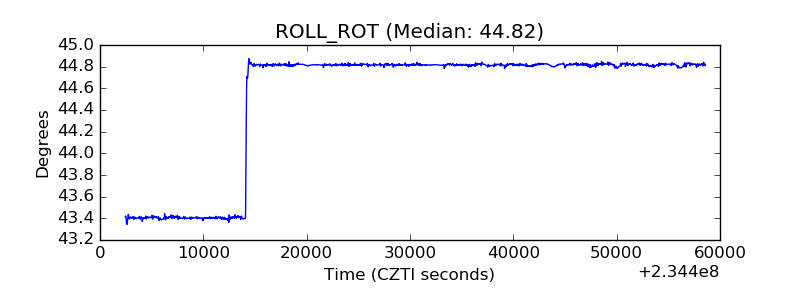 |
| _Roll_DEC |  |
| _Roll_RA |  |
| Veto Counter |  |