| Param | Original file | Final file |
|---|---|---|
| Filename | modeM0/AS1A03_105T01_9000001268cztM0_level2.evt | modeM0/AS1A03_105T01_9000001268cztM0_level2_quad_clean.evt |
| Size (bytes) | 6,272,288,640 | 1,087,251,840 |
| Size | 5.8 GB | 1.0 GB |
| Events in quadrant A | 51,204,985 | 6,750,674 |
| Events in quadrant B | 44,018,340 | 6,828,469 |
| Events in quadrant C | 41,600,661 | 6,667,456 |
| Events in quadrant D | 47,047,022 | 6,501,748 |
| Mode M0 | |||
|---|---|---|---|
| Quadrant | BADHDUFLAG | Total packets | Discarded packets |
| A | 0 | 209023 | 0 |
| B | 0 | 188594 | 0 |
| C | 0 | 186082 | 0 |
| D | 0 | 201415 | 0 |
| Mode M9 | |||
|---|---|---|---|
| Quadrant | BADHDUFLAG | Total packets | Discarded packets |
| A | 0 | 132 | 0 |
| B | 0 | 132 | 0 |
| C | 0 | 132 | 0 |
| D | 0 | 132 | 0 |
| Mode SS | |||
|---|---|---|---|
| Quadrant | BADHDUFLAG | Total packets | Discarded packets |
| A | 0 | 1848 | 0 |
| B | 0 | 1846 | 0 |
| C | 0 | 1840 | 0 |
| D | 0 | 1844 | 0 |
| Quadrant | Total seconds | Saturated seconds | Saturation percentage |
|---|---|---|---|
| A | 90192 | 1871 | 2.074463% |
| B | 90199 | 1521 | 1.686271% |
| C | 90222 | 986 | 1.092860% |
| D | 90136 | 1933 | 2.144537% |
Noise dominated data is calculated using 1-second bins in cleaned event files. If a bin has >2000 counts, and if more than 50% of those come from <1% of pixels, then it is considered to be noise-dominated and hence unusable.
| Quadrant | # 1 sec bins | Bins with >0 counts | Bins with >2000 counts | High rate bins dominated by noise | Noise dominated (total time) | Noise dominated (detector-on time) | Marked lightcurve |
|---|---|---|---|---|---|---|---|
| A | 103941 | 90669 | 350 | 350 | 0.34% | 0.39% |  |
| B | 103941 | 90647 | 52 | 52 | 0.05% | 0.06% |  |
| C | 103941 | 90672 | 61 | 61 | 0.06% | 0.07% | 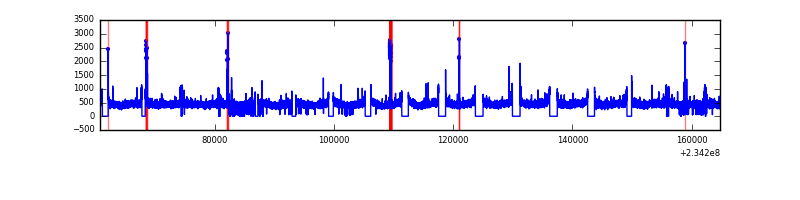 |
| D | 103941 | 90641 | 848 | 848 | 0.82% | 0.94% |  |
Top three noisy pixels from each quadrant. If the there are fewer than three noisy pixels in the level2.evt file, extra rows are filled as -1
| Pixel properties | Quadrant properties | ||||||
|---|---|---|---|---|---|---|---|
| Quadrant | DetID | PixID | Counts | Sigma | Mean | Median | Sigma |
| A | 8 | 5 | 6564212 | 2987.07 | 10951 | 10742 | 2193.9 |
| A | 1 | 162 | 697294 | 312.93 | 10951 | 10742 | 2193.9 |
| A | 4 | 2 | 521989 | 233.03 | 10951 | 10742 | 2193.9 |
| B | 0 | 214 | 990501 | 466.55 | 10995 | 10749 | 2100.0 |
| B | 12 | 111 | 239363 | 108.86 | 10995 | 10749 | 2100.0 |
| B | 11 | 111 | 193547 | 87.05 | 10995 | 10749 | 2100.0 |
| C | 14 | 234 | 215356 | 83.74 | 10597 | 10647 | 2444.6 |
| C | 13 | 61 | 79226 | 28.05 | 10597 | 10647 | 2444.6 |
| C | 12 | 4 | 45627 | 14.31 | 10597 | 10647 | 2444.6 |
| D | 1 | 52 | 3109294 | 1180.35 | 10548 | 10282 | 2625.5 |
| D | 12 | 233 | 1375237 | 519.89 | 10548 | 10282 | 2625.5 |
| D | 2 | 14 | 1194069 | 450.88 | 10548 | 10282 | 2625.5 |
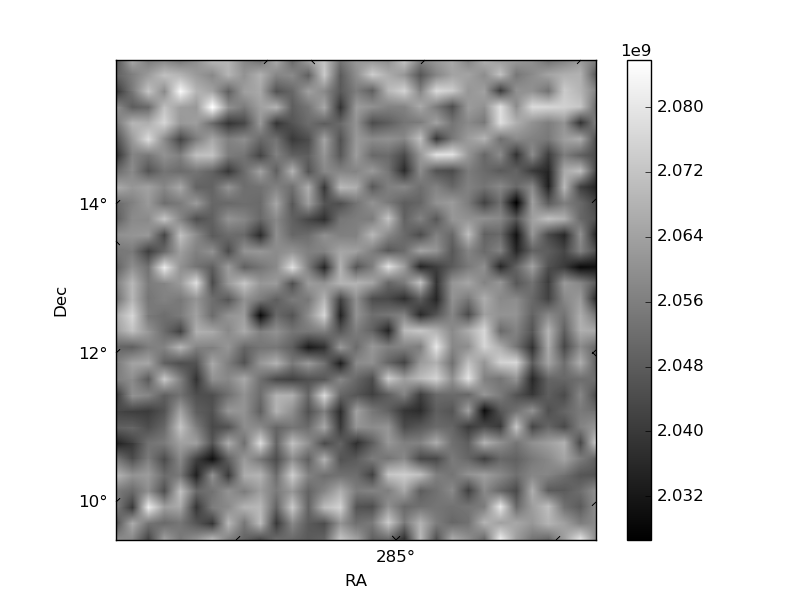
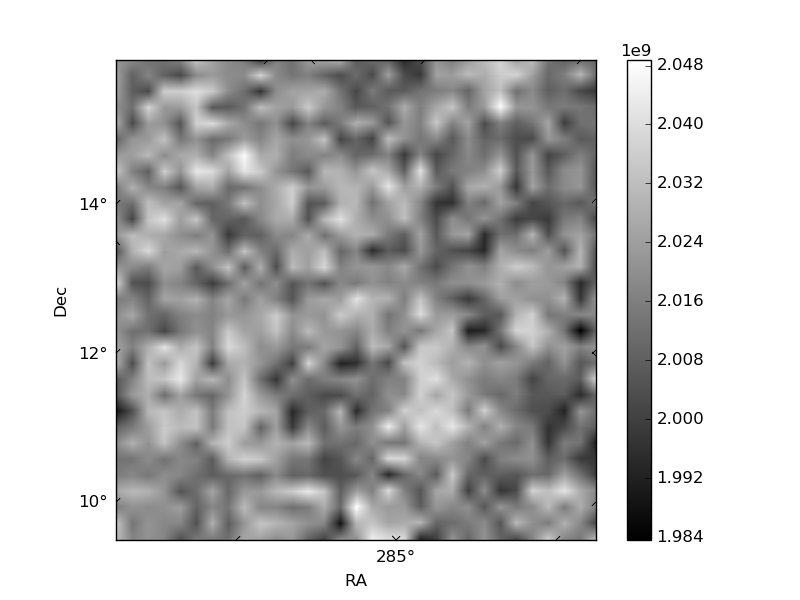
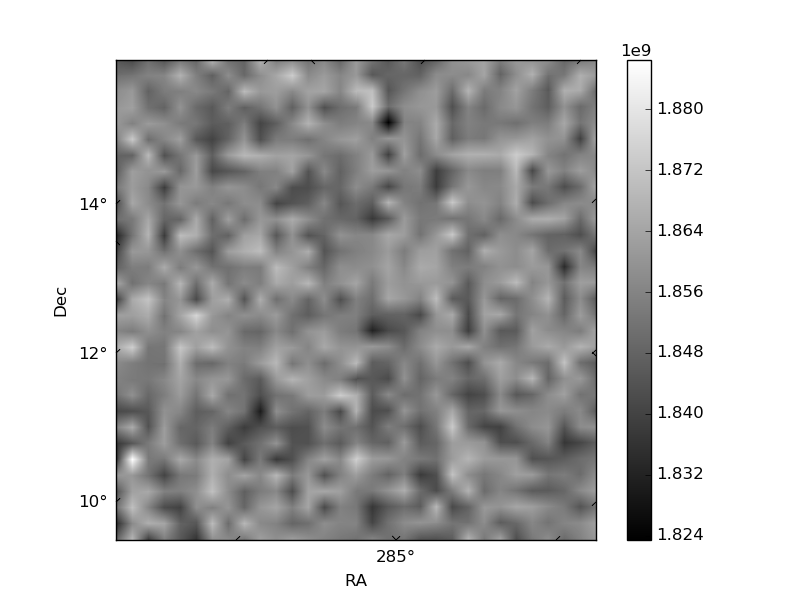
Histogram calculated using DETX and DETY for each event in the final _common_clean file
| Quadrant A |  |
 |
Quadrant B |
|---|---|---|---|
| Quadrant D |  |
 |
Quadrant C |
| Plot type | Count rate plots | Images |
|---|---|---|
| Comparison with Poisson distribution Blue bars denote a histogram of data divided into 1 sec bins. Red curve is a Poisson curve with rate = median count rate of data. |
 |
 |
| Quadrant-wise count rates Data is divided into 100 sec bins |
 |
|
| Module-wise count rates for Quadrant A Data is divided into 100 sec bins |
 |
 |
| Module-wise count rates for Quadrant B Data is divided into 100 sec bins |
 |
 |
| Module-wise count rates for Quadrant C Data is divided into 100 sec bins |
 |
 |
| Module-wise count rates for Quadrant D Data is divided into 100 sec bins |
 |
 |
| Parameter | Plot |
|---|---|
| CZT HV Monitor |  |
| D_VDD | 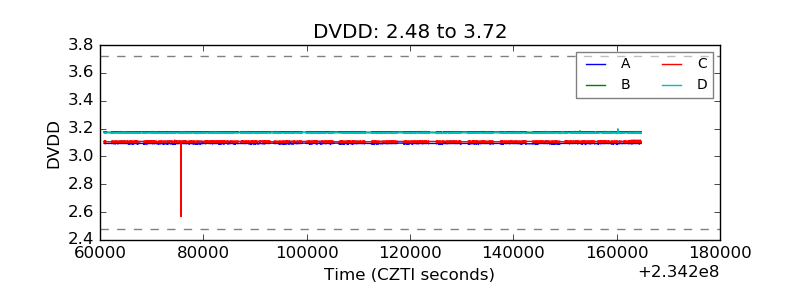 |
| Temperature 1 |  |
| Veto HV Monitor |  |
| Veto LLD |  |
| Alpha Counter |  |
| _CPM_Rate |  |
| CZT Counter |  |
| +2.5 Volts monitor |  |
| +5 Volts monitor |  |
| _ROLL_ROT |  |
| _Roll_DEC |  |
| _Roll_RA |  |
| Veto Counter |  |