| Param | Original file | Final file |
|---|---|---|
| Filename | modeM0/AS1G07_057T04_9000001264cztM0_level2.evt | modeM0/AS1G07_057T04_9000001264cztM0_level2_quad_clean.evt |
| Size (bytes) | 3,273,540,480 | 553,708,800 |
| Size | 3.0 GB | 528.1 MB |
| Events in quadrant A | 29,996,463 | 3,435,469 |
| Events in quadrant B | 22,329,299 | 3,518,636 |
| Events in quadrant C | 20,793,383 | 3,438,525 |
| Events in quadrant D | 23,044,338 | 3,349,824 |
| Mode M9 | |||
|---|---|---|---|
| Quadrant | BADHDUFLAG | Total packets | Discarded packets |
| A | 0 | 69 | 0 |
| B | 0 | 69 | 0 |
| C | 0 | 69 | 0 |
| D | 0 | 69 | 0 |
| Mode SS | |||
|---|---|---|---|
| Quadrant | BADHDUFLAG | Total packets | Discarded packets |
| A | 0 | 894 | 0 |
| B | 0 | 898 | 0 |
| C | 0 | 894 | 0 |
| D | 0 | 896 | 0 |
| Mode M0 | |||
|---|---|---|---|
| Quadrant | BADHDUFLAG | Total packets | Discarded packets |
| A | 0 | 117255 | 0 |
| B | 0 | 94086 | 0 |
| C | 0 | 91774 | 0 |
| D | 0 | 97727 | 0 |
| Quadrant | Total seconds | Saturated seconds | Saturation percentage |
|---|---|---|---|
| A | 44067 | 1913 | 4.341117% |
| B | 44149 | 904 | 2.047611% |
| C | 44154 | 589 | 1.333967% |
| D | 44128 | 860 | 1.948876% |
Noise dominated data is calculated using 1-second bins in cleaned event files. If a bin has >2000 counts, and if more than 50% of those come from <1% of pixels, then it is considered to be noise-dominated and hence unusable.
| Quadrant | # 1 sec bins | Bins with >0 counts | Bins with >2000 counts | High rate bins dominated by noise | Noise dominated (total time) | Noise dominated (detector-on time) | Marked lightcurve |
|---|---|---|---|---|---|---|---|
| A | 51093 | 44284 | 802 | 802 | 1.57% | 1.81% |  |
| B | 51093 | 44296 | 41 | 41 | 0.08% | 0.09% |  |
| C | 51093 | 44297 | 36 | 36 | 0.07% | 0.08% |  |
| D | 51093 | 44295 | 212 | 212 | 0.41% | 0.48% |  |
Top three noisy pixels from each quadrant. If the there are fewer than three noisy pixels in the level2.evt file, extra rows are filled as -1
| Pixel properties | Quadrant properties | ||||||
|---|---|---|---|---|---|---|---|
| Quadrant | DetID | PixID | Counts | Sigma | Mean | Median | Sigma |
| A | 8 | 5 | 8554537 | 7896.87 | 5392 | 5282 | 1082.6 |
| A | 1 | 162 | 294195 | 266.87 | 5392 | 5282 | 1082.6 |
| A | 5 | 16 | 139951 | 124.39 | 5392 | 5282 | 1082.6 |
| B | 0 | 214 | 298338 | 287.43 | 5444 | 5318 | 1019.4 |
| B | 4 | 48 | 259243 | 249.08 | 5444 | 5318 | 1019.4 |
| B | 4 | 80 | 113674 | 106.29 | 5444 | 5318 | 1019.4 |
| C | 14 | 234 | 294571 | 240.13 | 5254 | 5270 | 1204.8 |
| C | 13 | 61 | 40337 | 29.11 | 5254 | 5270 | 1204.8 |
| C | 12 | 4 | 16053 | 8.95 | 5254 | 5270 | 1204.8 |
| D | 1 | 52 | 752988 | 547.0 | 5240 | 5113 | 1367.2 |
| D | 7 | 71 | 591635 | 428.99 | 5240 | 5113 | 1367.2 |
| D | 2 | 14 | 463963 | 335.61 | 5240 | 5113 | 1367.2 |
Histogram calculated using DETX and DETY for each event in the final _common_clean file
| Quadrant A |  |
 |
Quadrant B |
|---|---|---|---|
| Quadrant D | 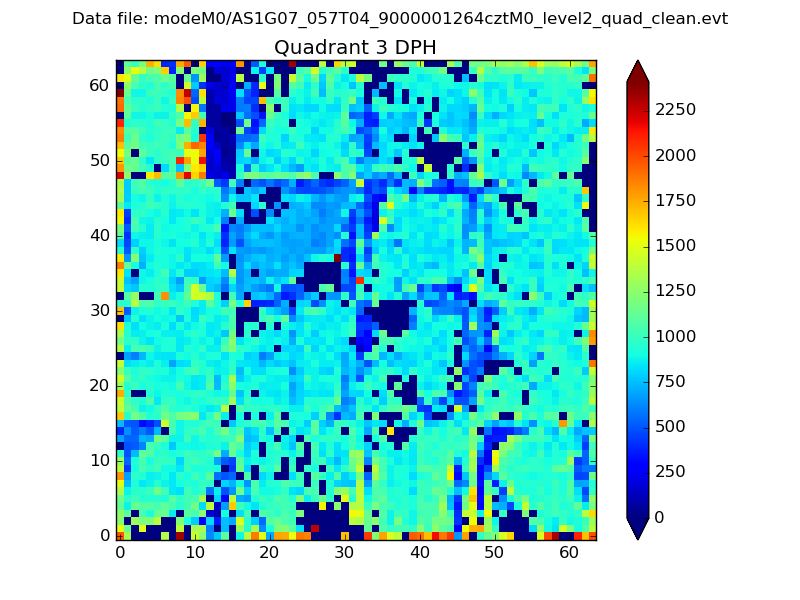 |
 |
Quadrant C |
| Plot type | Count rate plots | Images |
|---|---|---|
| Comparison with Poisson distribution Blue bars denote a histogram of data divided into 1 sec bins. Red curve is a Poisson curve with rate = median count rate of data. |
 |
 |
| Quadrant-wise count rates Data is divided into 100 sec bins |
 |
|
| Module-wise count rates for Quadrant A Data is divided into 100 sec bins |
 |
 |
| Module-wise count rates for Quadrant B Data is divided into 100 sec bins |
 |
 |
| Module-wise count rates for Quadrant C Data is divided into 100 sec bins |
 |
 |
| Module-wise count rates for Quadrant D Data is divided into 100 sec bins |
 |
 |
| Parameter | Plot |
|---|---|
| CZT HV Monitor |  |
| D_VDD |  |
| Temperature 1 | 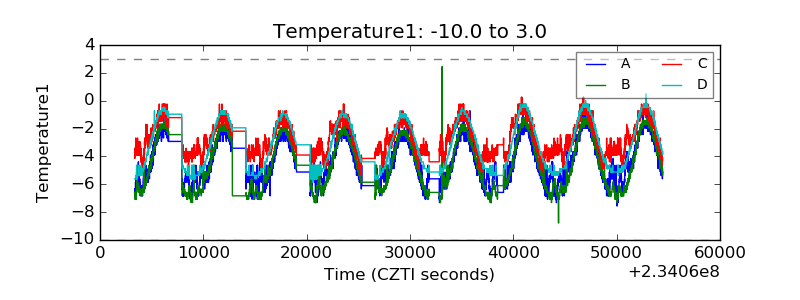 |
| Veto HV Monitor |  |
| Veto LLD |  |
| Alpha Counter |  |
| _CPM_Rate |  |
| CZT Counter |  |
| +2.5 Volts monitor |  |
| +5 Volts monitor |  |
| _ROLL_ROT |  |
| _Roll_DEC | 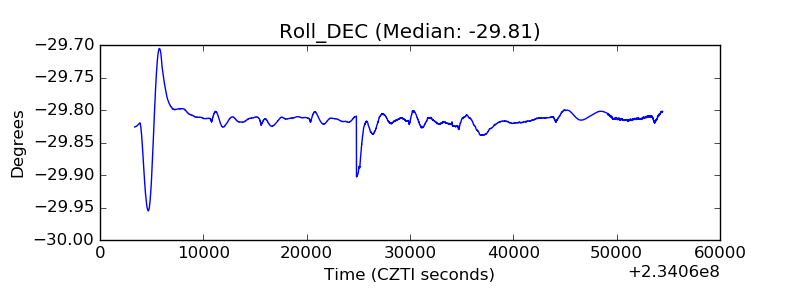 |
| _Roll_RA |  |
| Veto Counter |  |