| Param | Original file | Final file |
|---|---|---|
| Filename | modeM0/AS1G07_070T02_9000001262cztM0_level2.evt | modeM0/AS1G07_070T02_9000001262cztM0_level2_quad_clean.evt |
| Size (bytes) | 2,468,718,720 | 424,183,680 |
| Size | 2.3 GB | 404.5 MB |
| Events in quadrant A | 20,302,846 | 2,600,821 |
| Events in quadrant B | 16,985,886 | 2,646,961 |
| Events in quadrant C | 15,871,751 | 2,627,548 |
| Events in quadrant D | 19,216,186 | 2,541,954 |
| Mode SS | |||
|---|---|---|---|
| Quadrant | BADHDUFLAG | Total packets | Discarded packets |
| A | 0 | 722 | 0 |
| B | 0 | 722 | 0 |
| C | 0 | 722 | 0 |
| D | 0 | 720 | 0 |
| Mode M9 | |||
|---|---|---|---|
| Quadrant | BADHDUFLAG | Total packets | Discarded packets |
| A | 0 | 46 | 0 |
| B | 0 | 46 | 0 |
| C | 0 | 46 | 0 |
| D | 0 | 46 | 0 |
| Mode M0 | |||
|---|---|---|---|
| Quadrant | BADHDUFLAG | Total packets | Discarded packets |
| A | 0 | 84029 | 0 |
| B | 0 | 74784 | 0 |
| C | 0 | 72526 | 0 |
| D | 0 | 81931 | 0 |
| Quadrant | Total seconds | Saturated seconds | Saturation percentage |
|---|---|---|---|
| A | 35385 | 587 | 1.658895% |
| B | 35383 | 494 | 1.396151% |
| C | 35385 | 266 | 0.751731% |
| D | 35388 | 869 | 2.455635% |
Noise dominated data is calculated using 1-second bins in cleaned event files. If a bin has >2000 counts, and if more than 50% of those come from <1% of pixels, then it is considered to be noise-dominated and hence unusable.
| Quadrant | # 1 sec bins | Bins with >0 counts | Bins with >2000 counts | High rate bins dominated by noise | Noise dominated (total time) | Noise dominated (detector-on time) | Marked lightcurve |
|---|---|---|---|---|---|---|---|
| A | 39995 | 35403 | 28 | 28 | 0.07% | 0.08% |  |
| B | 39995 | 35401 | 90 | 90 | 0.23% | 0.25% |  |
| C | 39995 | 35403 | 14 | 14 | 0.04% | 0.04% | 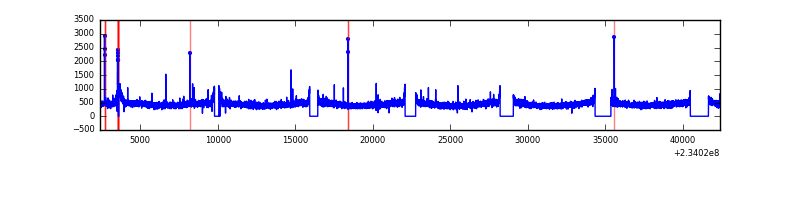 |
| D | 39995 | 35402 | 474 | 474 | 1.19% | 1.34% |  |
Top three noisy pixels from each quadrant. If the there are fewer than three noisy pixels in the level2.evt file, extra rows are filled as -1
| Pixel properties | Quadrant properties | ||||||
|---|---|---|---|---|---|---|---|
| Quadrant | DetID | PixID | Counts | Sigma | Mean | Median | Sigma |
| A | 8 | 5 | 4226214 | 5087.84 | 4110 | 4018 | 829.9 |
| A | 1 | 162 | 83887 | 96.24 | 4110 | 4018 | 829.9 |
| A | 5 | 16 | 71422 | 81.22 | 4110 | 4018 | 829.9 |
| B | 10 | 16 | 671856 | 849.08 | 4146 | 4042 | 786.5 |
| B | 12 | 111 | 87907 | 106.63 | 4146 | 4042 | 786.5 |
| B | 11 | 111 | 71041 | 85.18 | 4146 | 4042 | 786.5 |
| C | 14 | 234 | 83599 | 85.59 | 4032 | 4052 | 929.3 |
| C | 13 | 61 | 30312 | 28.26 | 4032 | 4052 | 929.3 |
| C | 9 | 68 | 26765 | 24.44 | 4032 | 4052 | 929.3 |
| D | 2 | 14 | 1530537 | 1493.26 | 3982 | 3877 | 1022.4 |
| D | 1 | 52 | 1207271 | 1177.06 | 3982 | 3877 | 1022.4 |
| D | 8 | 195 | 400659 | 388.1 | 3982 | 3877 | 1022.4 |
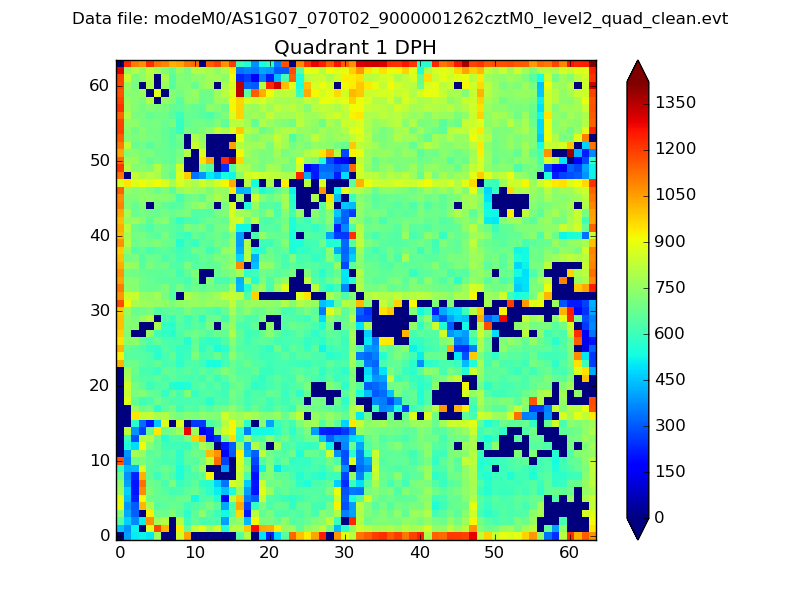
Histogram calculated using DETX and DETY for each event in the final _common_clean file
| Quadrant A | 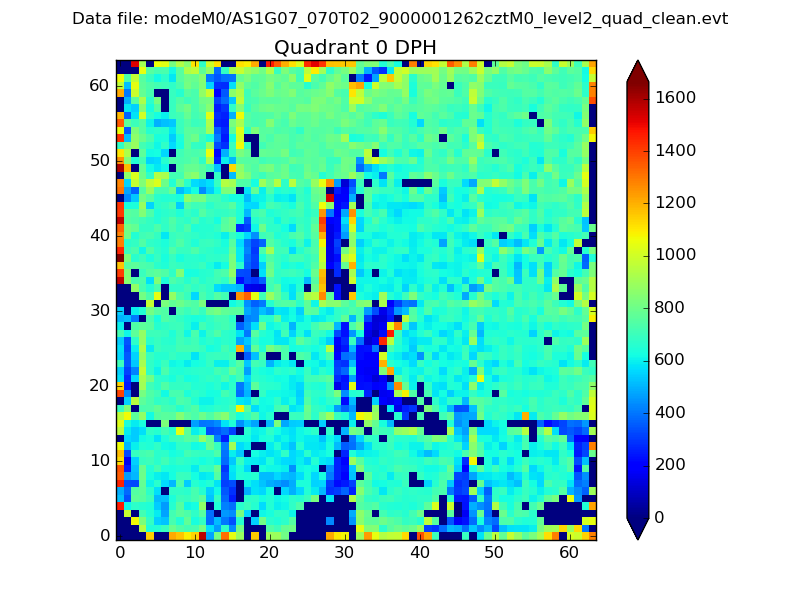 |
 |
Quadrant B |
|---|---|---|---|
| Quadrant D |  |
 |
Quadrant C |
| Plot type | Count rate plots | Images |
|---|---|---|
| Comparison with Poisson distribution Blue bars denote a histogram of data divided into 1 sec bins. Red curve is a Poisson curve with rate = median count rate of data. |
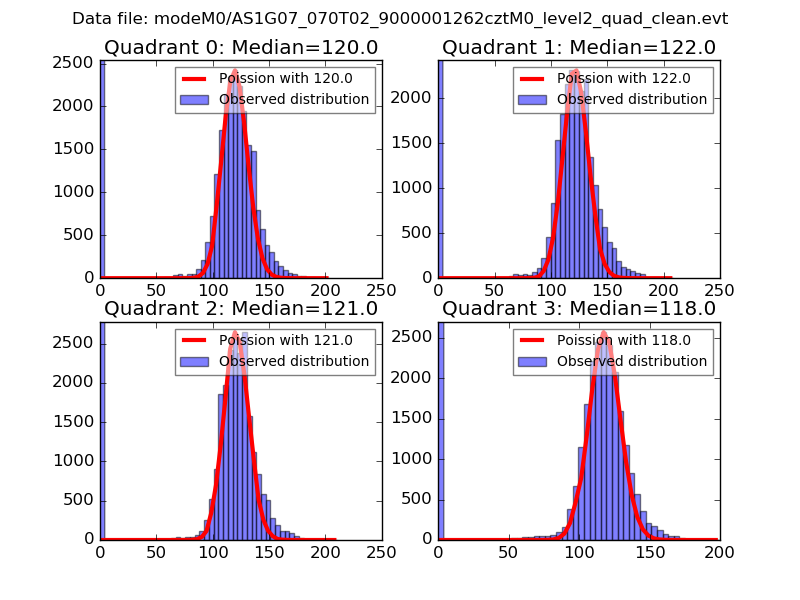 |
 |
| Quadrant-wise count rates Data is divided into 100 sec bins |
 |
|
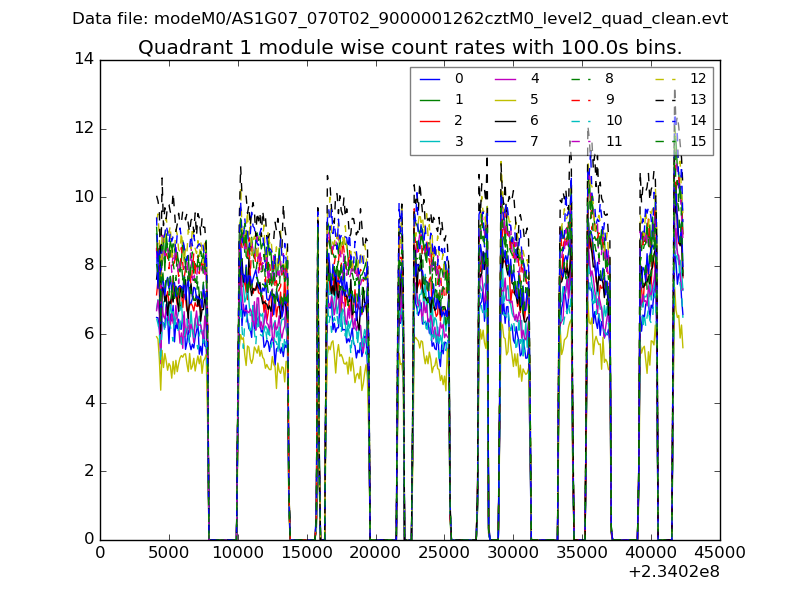
| Module-wise count rates for Quadrant A Data is divided into 100 sec bins |
 |
 |
| Module-wise count rates for Quadrant B Data is divided into 100 sec bins |
 |
 |
| Module-wise count rates for Quadrant C Data is divided into 100 sec bins |
 |
 |
| Module-wise count rates for Quadrant D Data is divided into 100 sec bins |
 |
 |
| Parameter | Plot |
|---|---|
| CZT HV Monitor | 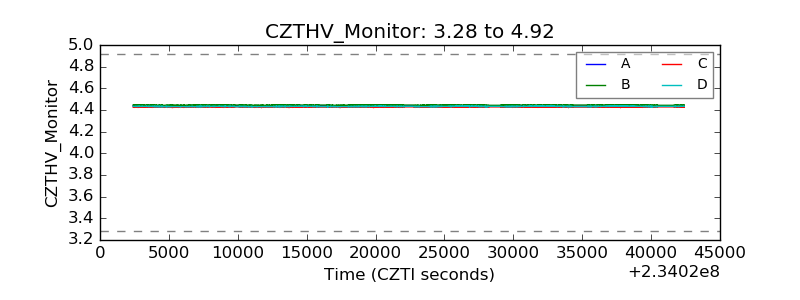 |
| D_VDD |  |
| Temperature 1 | 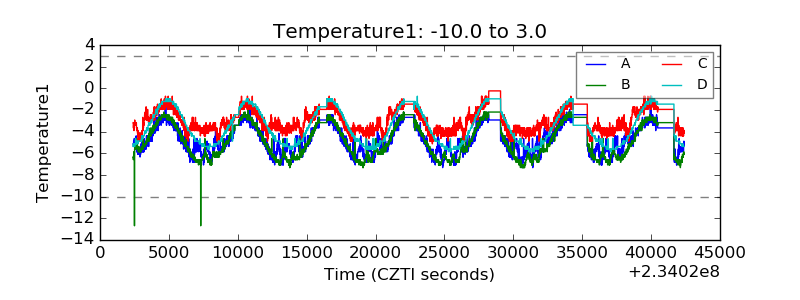 |
| Veto HV Monitor |  |
| Veto LLD |  |
| Alpha Counter |  |
| _CPM_Rate |  |
| CZT Counter |  |
| +2.5 Volts monitor |  |
| +5 Volts monitor |  |
| _ROLL_ROT |  |
| _Roll_DEC | 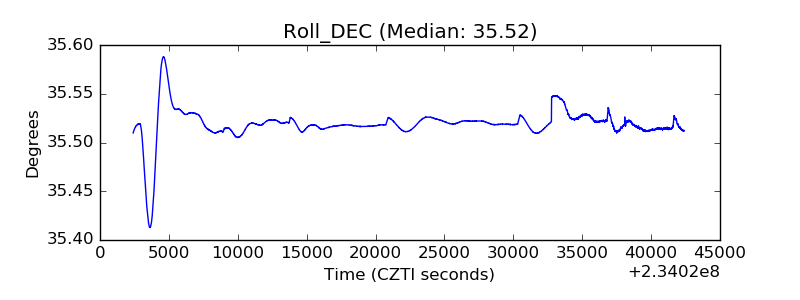 |
| _Roll_RA | 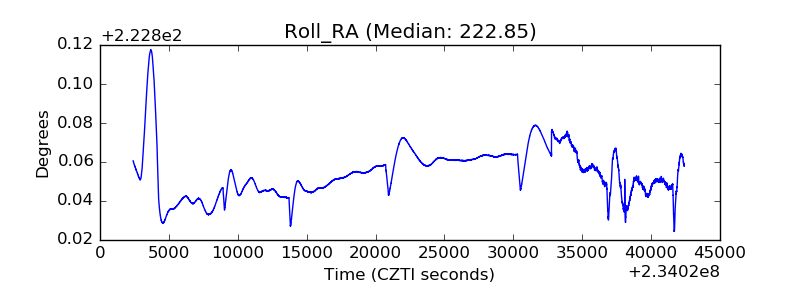 |
| Veto Counter |  |