| Param | Original file | Final file |
|---|---|---|
| Filename | modeM0/AS1G07_027T01_9000001258cztM0_level2.evt | modeM0/AS1G07_027T01_9000001258cztM0_level2_quad_clean.evt |
| Size (bytes) | 1,427,486,400 | 274,654,080 |
| Size | 1.3 GB | 261.9 MB |
| Events in quadrant A | 10,975,976 | 1,742,648 |
| Events in quadrant B | 10,057,175 | 1,766,158 |
| Events in quadrant C | 9,402,792 | 1,733,701 |
| Events in quadrant D | 11,404,102 | 1,659,187 |
| Mode M0 | |||
|---|---|---|---|
| Quadrant | BADHDUFLAG | Total packets | Discarded packets |
| A | 0 | 45589 | 0 |
| B | 0 | 43435 | 0 |
| C | 0 | 42235 | 0 |
| D | 0 | 48523 | 0 |
| Mode SS | |||
|---|---|---|---|
| Quadrant | BADHDUFLAG | Total packets | Discarded packets |
| A | 0 | 420 | 0 |
| B | 0 | 416 | 0 |
| C | 0 | 418 | 0 |
| D | 0 | 416 | 0 |
| Mode M9 | |||
|---|---|---|---|
| Quadrant | BADHDUFLAG | Total packets | Discarded packets |
| A | 0 | 46 | 0 |
| B | 0 | 46 | 0 |
| C | 0 | 46 | 0 |
| D | 0 | 46 | 0 |
| Quadrant | Total seconds | Saturated seconds | Saturation percentage |
|---|---|---|---|
| A | 20585 | 118 | 0.573233% |
| B | 20587 | 153 | 0.743187% |
| C | 20580 | 58 | 0.281827% |
| D | 20580 | 340 | 1.652089% |
Noise dominated data is calculated using 1-second bins in cleaned event files. If a bin has >2000 counts, and if more than 50% of those come from <1% of pixels, then it is considered to be noise-dominated and hence unusable.
| Quadrant | # 1 sec bins | Bins with >0 counts | Bins with >2000 counts | High rate bins dominated by noise | Noise dominated (total time) | Noise dominated (detector-on time) | Marked lightcurve |
|---|---|---|---|---|---|---|---|
| A | 25643 | 20895 | 16 | 16 | 0.06% | 0.08% |  |
| B | 25643 | 20908 | 25 | 25 | 0.10% | 0.12% |  |
| C | 25643 | 20907 | 6 | 6 | 0.02% | 0.03% |  |
| D | 25643 | 20900 | 245 | 245 | 0.96% | 1.17% |  |
Top three noisy pixels from each quadrant. If the there are fewer than three noisy pixels in the level2.evt file, extra rows are filled as -1
| Pixel properties | Quadrant properties | ||||||
|---|---|---|---|---|---|---|---|
| Quadrant | DetID | PixID | Counts | Sigma | Mean | Median | Sigma |
| A | 8 | 5 | 928726 | 1866.93 | 2475 | 2433 | 496.2 |
| A | 1 | 162 | 174912 | 347.63 | 2475 | 2433 | 496.2 |
| A | 3 | 1 | 118548 | 234.03 | 2475 | 2433 | 496.2 |
| B | 6 | 51 | 73200 | 151.91 | 2486 | 2434 | 465.9 |
| B | 10 | 245 | 63304 | 130.66 | 2486 | 2434 | 465.9 |
| B | 12 | 111 | 49896 | 101.88 | 2486 | 2434 | 465.9 |
| C | 14 | 234 | 61434 | 107.62 | 2390 | 2415 | 548.4 |
| C | 3 | 254 | 23189 | 37.88 | 2390 | 2415 | 548.4 |
| C | 13 | 61 | 18010 | 28.44 | 2390 | 2415 | 548.4 |
| D | 6 | 225 | 901476 | 1556.06 | 2358 | 2303 | 577.9 |
| D | 2 | 14 | 837740 | 1445.76 | 2358 | 2303 | 577.9 |
| D | 7 | 71 | 225070 | 385.51 | 2358 | 2303 | 577.9 |
Histogram calculated using DETX and DETY for each event in the final _common_clean file
| Quadrant A | 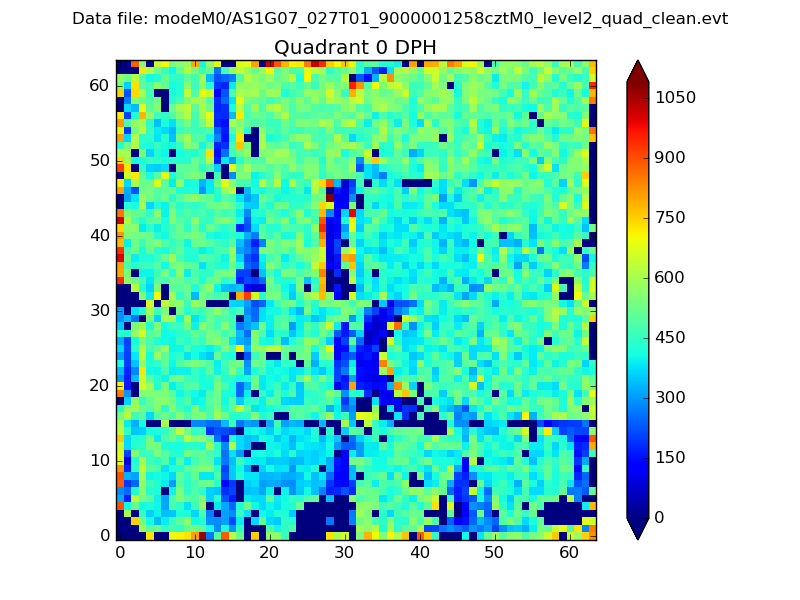 |
 |
Quadrant B |
|---|---|---|---|
| Quadrant D |  |
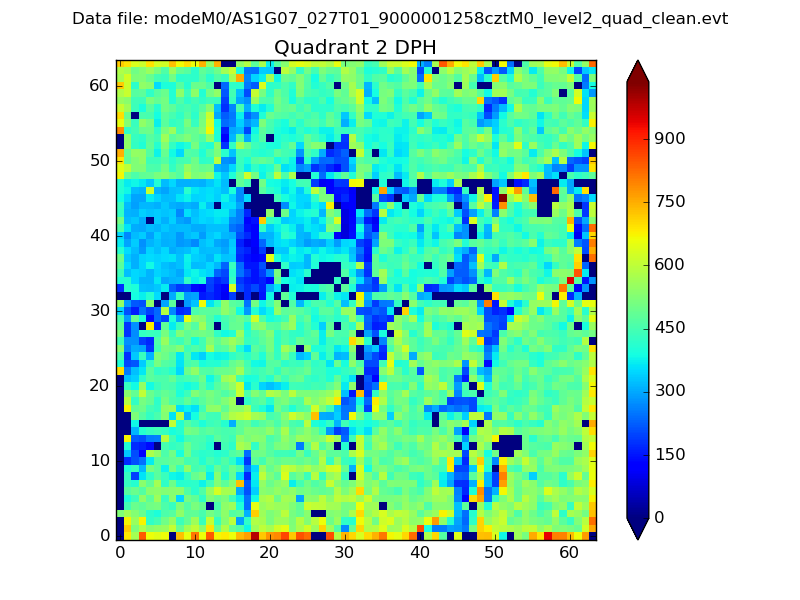 |
Quadrant C |
| Plot type | Count rate plots | Images |
|---|---|---|
| Comparison with Poisson distribution Blue bars denote a histogram of data divided into 1 sec bins. Red curve is a Poisson curve with rate = median count rate of data. |
 |
 |
| Quadrant-wise count rates Data is divided into 100 sec bins |
 |
|
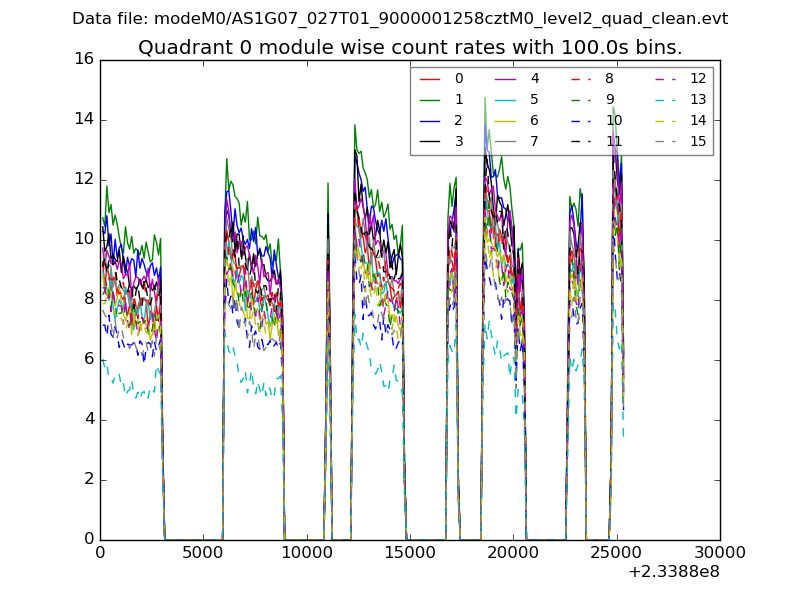
| Module-wise count rates for Quadrant A Data is divided into 100 sec bins |
 |
 |
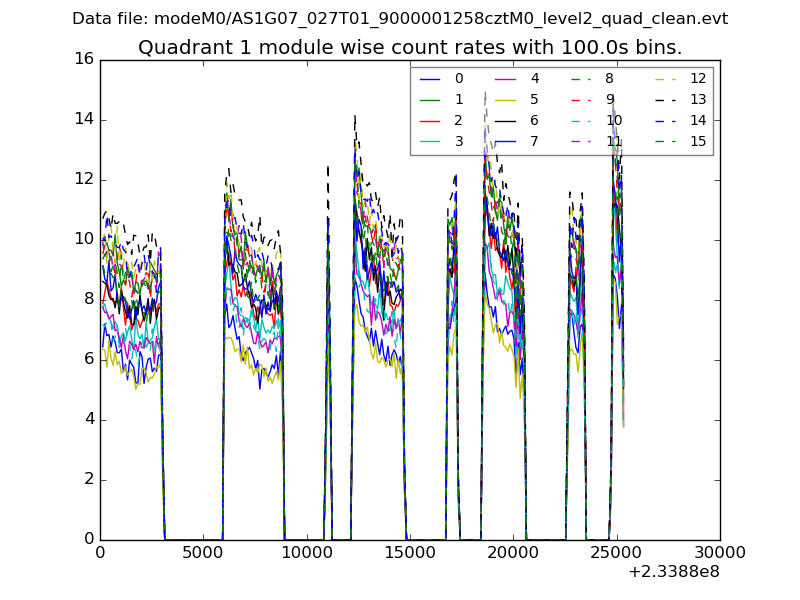
| Module-wise count rates for Quadrant B Data is divided into 100 sec bins |
 |
 |
| Module-wise count rates for Quadrant C Data is divided into 100 sec bins |
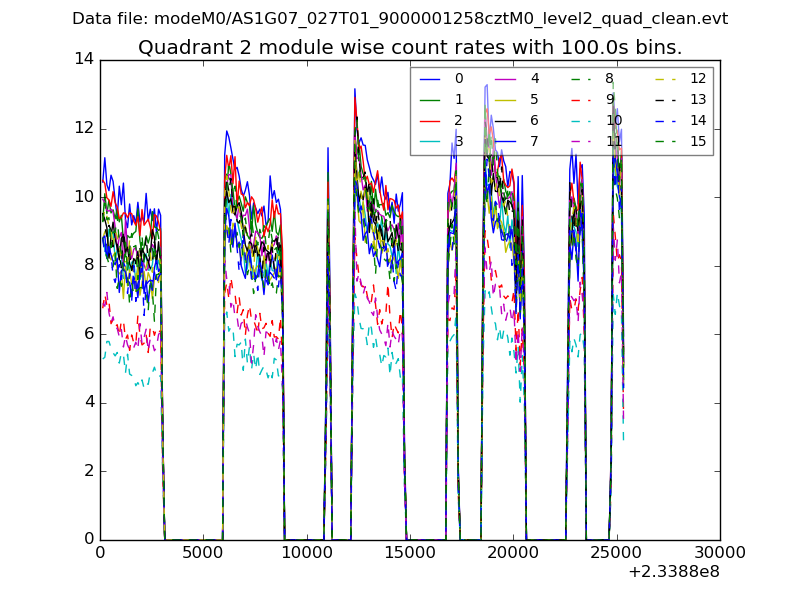 |
 |
| Module-wise count rates for Quadrant D Data is divided into 100 sec bins |
 |
 |
| Parameter | Plot |
|---|---|
| CZT HV Monitor |  |
| D_VDD |  |
| Temperature 1 |  |
| Veto HV Monitor |  |
| Veto LLD |  |
| Alpha Counter |  |
| _CPM_Rate |  |
| CZT Counter |  |
| +2.5 Volts monitor |  |
| +5 Volts monitor |  |
| _ROLL_ROT |  |
| _Roll_DEC |  |
| _Roll_RA |  |
| Veto Counter | 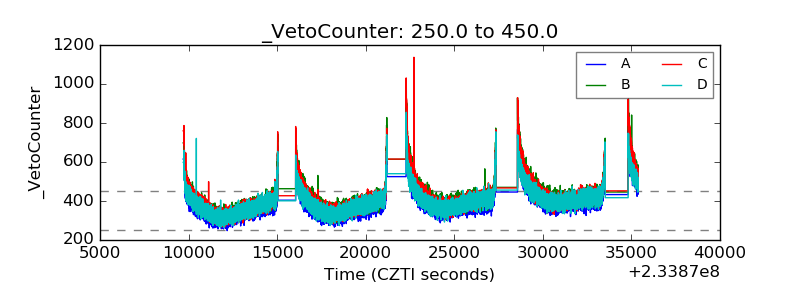 |