| Param | Original file | Final file |
|---|---|---|
| Filename | modeM0/AS1G07_029T02_9000001256cztM0_level2_bc.evt | modeM0/AS1G07_029T02_9000001256cztM0_level2_quad_clean.evt |
| Size (bytes) | 633,513,600 | 194,976,000 |
| Size | 604.2 MB | 185.9 MB |
| Events in quadrant A | 6,386,000 | 1,192,922 |
| Events in quadrant B | 4,018,779 | 1,214,780 |
| Events in quadrant C | 2,998,033 | 1,202,343 |
| Events in quadrant D | 4,656,903 | 1,160,975 |
| Mode SS | |||
|---|---|---|---|
| Quadrant | BADHDUFLAG | Total packets | Discarded packets |
| A | 0 | 330 | 0 |
| B | 0 | 332 | 0 |
| C | 0 | 332 | 0 |
| D | 0 | 330 | 0 |
| Mode M9 | |||
|---|---|---|---|
| Quadrant | BADHDUFLAG | Total packets | Discarded packets |
| A | 0 | 12 | 0 |
| B | 0 | 12 | 0 |
| C | 0 | 12 | 0 |
| D | 0 | 12 | 0 |
| Mode M0 | |||
|---|---|---|---|
| Quadrant | BADHDUFLAG | Total packets | Discarded packets |
| A | 0 | 44870 | 0 |
| B | 0 | 36723 | 0 |
| C | 0 | 33331 | 0 |
| D | 0 | 37623 | 0 |
| Quadrant | Total seconds | Saturated seconds | Saturation percentage |
|---|---|---|---|
| A | 16440 | 394 | 2.396594% |
| B | 16453 | 239 | 1.452623% |
| C | 16453 | 46 | 0.279584% |
| D | 16456 | 220 | 1.336898% |
Noise dominated data is calculated using 1-second bins in cleaned event files. If a bin has >2000 counts, and if more than 50% of those come from <1% of pixels, then it is considered to be noise-dominated and hence unusable.
| Quadrant | # 1 sec bins | Bins with >0 counts | Bins with >2000 counts | High rate bins dominated by noise | Noise dominated (total time) | Noise dominated (detector-on time) | Marked lightcurve |
|---|---|---|---|---|---|---|---|
| A | 17677 | 16525 | 33 | 33 | 0.19% | 0.20% |  |
| B | 17677 | 16527 | 10 | 10 | 0.06% | 0.06% |  |
| C | 17677 | 16531 | 2 | 2 | 0.01% | 0.01% |  |
| D | 17677 | 16530 | 76 | 76 | 0.43% | 0.46% |  |
Top three noisy pixels from each quadrant. If the there are fewer than three noisy pixels in the level2.evt file, extra rows are filled as -1
| Pixel properties | Quadrant properties | ||||||
|---|---|---|---|---|---|---|---|
| Quadrant | DetID | PixID | Counts | Sigma | Mean | Median | Sigma |
| A | 8 | 5 | 2896209 | 16796.56 | 766 | 748 | 172.4 |
| A | 5 | 16 | 246272 | 1424.28 | 766 | 748 | 172.4 |
| A | 3 | 1 | 134912 | 778.28 | 766 | 748 | 172.4 |
| B | 4 | 48 | 358582 | 2350.81 | 775 | 753 | 152.2 |
| B | 10 | 16 | 297028 | 1946.42 | 775 | 753 | 152.2 |
| B | 0 | 230 | 98763 | 643.89 | 775 | 753 | 152.2 |
| C | 14 | 234 | 24292 | 136.72 | 759 | 746 | 172.2 |
| C | 13 | 61 | 4797 | 23.52 | 759 | 746 | 172.2 |
| C | 12 | 4 | 2424 | 9.74 | 759 | 746 | 172.2 |
| D | 6 | 225 | 987967 | 5139.56 | 757 | 732 | 192.1 |
| D | 1 | 52 | 180281 | 934.74 | 757 | 732 | 192.1 |
| D | 2 | 14 | 144910 | 750.59 | 757 | 732 | 192.1 |
Histogram calculated using DETX and DETY for each event in the final _common_clean file
| Quadrant A |  |
 |
Quadrant B |
|---|---|---|---|
| Quadrant D |  |
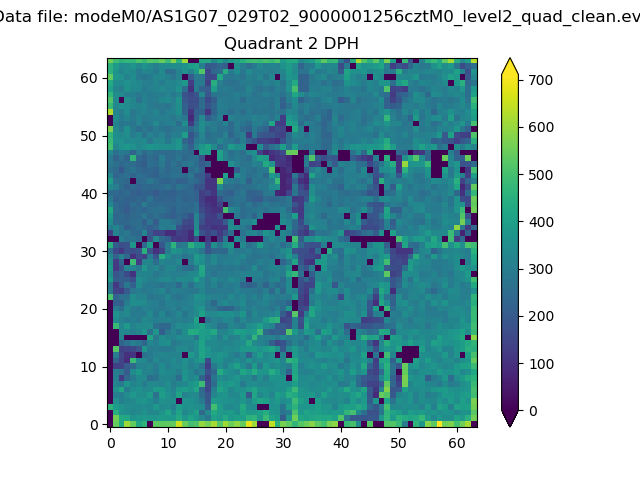 |
Quadrant C |
| Plot type | Count rate plots | Images |
|---|---|---|
| Comparison with Poisson distribution Blue bars denote a histogram of data divided into 1 sec bins. Red curve is a Poisson curve with rate = median count rate of data. |
 |
 |
| Quadrant-wise count rates Data is divided into 100 sec bins |
 |
|
| Module-wise count rates for Quadrant A Data is divided into 100 sec bins |
 |
 |
| Module-wise count rates for Quadrant B Data is divided into 100 sec bins |
 |
 |
| Module-wise count rates for Quadrant C Data is divided into 100 sec bins |
 |
 |
| Module-wise count rates for Quadrant D Data is divided into 100 sec bins |
 |
 |
| Parameter | Plot |
|---|---|
| CZT HV Monitor |  |
| D_VDD |  |
| Temperature 1 |  |
| Veto HV Monitor |  |
| Veto LLD |  |
| Alpha Counter |  |
| _CPM_Rate |  |
| CZT Counter |  |
| +2.5 Volts monitor |  |
| +5 Volts monitor |  |
| _ROLL_ROT |  |
| _Roll_DEC |  |
| _Roll_RA |  |
| Veto Counter |  |