| Param | Original file | Final file |
|---|---|---|
| Filename | modeM0/AS1C02_037T01_9000001252cztM0_level2.evt | modeM0/AS1C02_037T01_9000001252cztM0_level2_quad_clean.evt |
| Size (bytes) | 7,094,056,320 | 1,129,662,720 |
| Size | 6.6 GB | 1.1 GB |
| Events in quadrant A | 57,382,687 | 7,077,500 |
| Events in quadrant B | 49,511,178 | 7,112,421 |
| Events in quadrant C | 41,669,359 | 7,032,072 |
| Events in quadrant D | 60,093,720 | 6,697,575 |
| Mode M0 | |||
|---|---|---|---|
| Quadrant | BADHDUFLAG | Total packets | Discarded packets |
| A | 0 | 230257 | 0 |
| B | 0 | 206328 | 0 |
| C | 0 | 187929 | 0 |
| D | 0 | 239705 | 0 |
| Mode M9 | |||
|---|---|---|---|
| Quadrant | BADHDUFLAG | Total packets | Discarded packets |
| A | 0 | 126 | 0 |
| B | 0 | 127 | 0 |
| C | 0 | 127 | 0 |
| D | 0 | 127 | 0 |
| Mode SS | |||
|---|---|---|---|
| Quadrant | BADHDUFLAG | Total packets | Discarded packets |
| A | 0 | 1876 | 0 |
| B | 0 | 1871 | 0 |
| C | 0 | 1870 | 0 |
| D | 0 | 1876 | 0 |
| Quadrant | Total seconds | Saturated seconds | Saturation percentage |
|---|---|---|---|
| A | 91789 | 2006 | 2.185447% |
| B | 91852 | 2194 | 2.388625% |
| C | 91886 | 604 | 0.657336% |
| D | 91869 | 4775 | 5.197618% |
Noise dominated data is calculated using 1-second bins in cleaned event files. If a bin has >2000 counts, and if more than 50% of those come from <1% of pixels, then it is considered to be noise-dominated and hence unusable.
| Quadrant | # 1 sec bins | Bins with >0 counts | Bins with >2000 counts | High rate bins dominated by noise | Noise dominated (total time) | Noise dominated (detector-on time) | Marked lightcurve |
|---|---|---|---|---|---|---|---|
| A | 104790 | 92071 | 634 | 634 | 0.61% | 0.69% |  |
| B | 104790 | 92097 | 887 | 887 | 0.85% | 0.96% |  |
| C | 104790 | 92103 | 8 | 8 | 0.01% | 0.01% |  |
| D | 104790 | 92117 | 3786 | 3786 | 3.61% | 4.11% |  |
Top three noisy pixels from each quadrant. If the there are fewer than three noisy pixels in the level2.evt file, extra rows are filled as -1
| Pixel properties | Quadrant properties | ||||||
|---|---|---|---|---|---|---|---|
| Quadrant | DetID | PixID | Counts | Sigma | Mean | Median | Sigma |
| A | 8 | 5 | 13520536 | 6117.9 | 10978 | 10755 | 2208.2 |
| A | 3 | 1 | 390674 | 172.05 | 10978 | 10755 | 2208.2 |
| A | 1 | 162 | 310244 | 135.62 | 10978 | 10755 | 2208.2 |
| B | 10 | 16 | 3340677 | 1585.7 | 11008 | 10754 | 2100.0 |
| B | 0 | 230 | 910004 | 428.22 | 11008 | 10754 | 2100.0 |
| B | 4 | 48 | 814190 | 382.59 | 11008 | 10754 | 2100.0 |
| C | 13 | 61 | 81198 | 28.67 | 10641 | 10706 | 2459.1 |
| C | 9 | 68 | 75540 | 26.37 | 10641 | 10706 | 2459.1 |
| C | 14 | 234 | 42971 | 13.12 | 10641 | 10706 | 2459.1 |
| D | 1 | 52 | 12436057 | 4728.17 | 10422 | 10152 | 2628.1 |
| D | 6 | 225 | 2410211 | 913.24 | 10422 | 10152 | 2628.1 |
| D | 7 | 71 | 1669105 | 631.25 | 10422 | 10152 | 2628.1 |
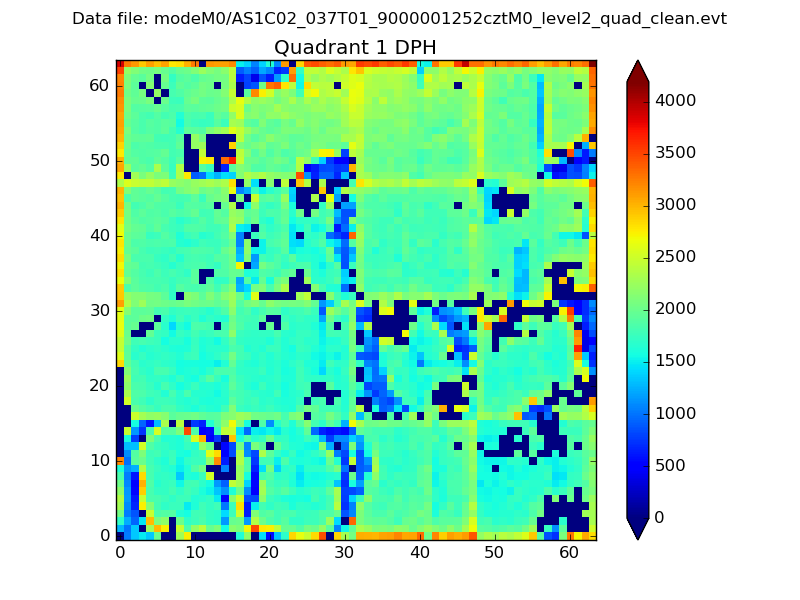
Histogram calculated using DETX and DETY for each event in the final _common_clean file
| Quadrant A |  |
 |
Quadrant B |
|---|---|---|---|
| Quadrant D |  |
 |
Quadrant C |
| Plot type | Count rate plots | Images |
|---|---|---|
| Comparison with Poisson distribution Blue bars denote a histogram of data divided into 1 sec bins. Red curve is a Poisson curve with rate = median count rate of data. |
 |
 |
| Quadrant-wise count rates Data is divided into 100 sec bins |
 |
|
| Module-wise count rates for Quadrant A Data is divided into 100 sec bins |
 |
 |
| Module-wise count rates for Quadrant B Data is divided into 100 sec bins |
 |
 |
| Module-wise count rates for Quadrant C Data is divided into 100 sec bins |
 |
 |
| Module-wise count rates for Quadrant D Data is divided into 100 sec bins |
 |
 |
| Parameter | Plot |
|---|---|
| CZT HV Monitor |  |
| D_VDD | 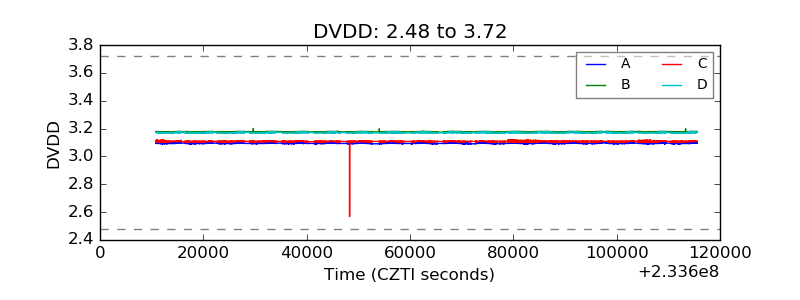 |
| Temperature 1 |  |
| Veto HV Monitor | 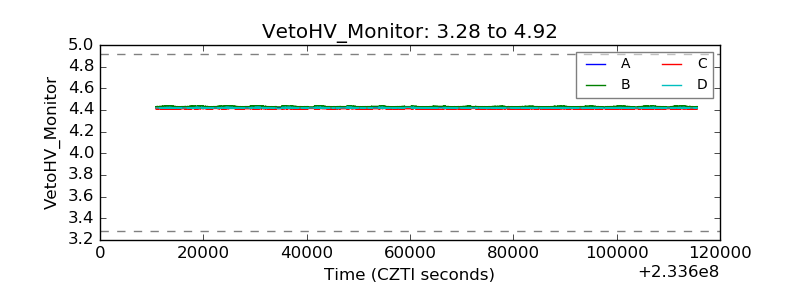 |
| Veto LLD |  |
| Alpha Counter |  |
| _CPM_Rate |  |
| CZT Counter |  |
| +2.5 Volts monitor |  |
| +5 Volts monitor | 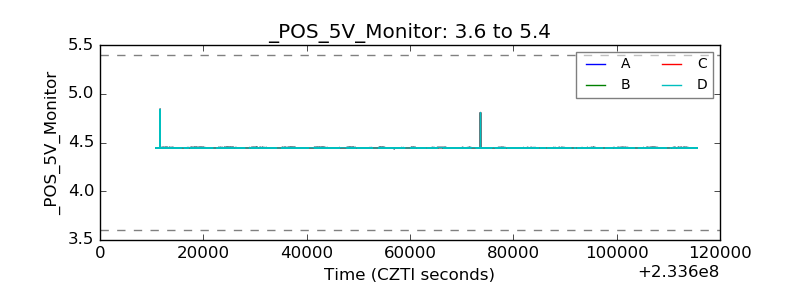 |
| _ROLL_ROT |  |
| _Roll_DEC |  |
| _Roll_RA |  |
| Veto Counter | 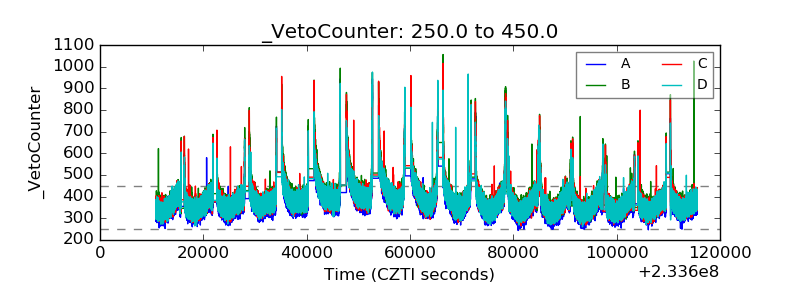 |