| Param | Original file | Final file |
|---|---|---|
| Filename | modeM0/AS1A03_107T01_9000001246cztM0_level2.evt | modeM0/AS1A03_107T01_9000001246cztM0_level2_quad_clean.evt |
| Size (bytes) | 2,232,815,040 | 290,833,920 |
| Size | 2.1 GB | 277.4 MB |
| Events in quadrant A | 13,472,010 | 1,876,650 |
| Events in quadrant B | 24,175,682 | 1,783,360 |
| Events in quadrant C | 14,797,096 | 1,820,625 |
| Events in quadrant D | 13,655,921 | 1,772,422 |
| Mode M9 | |||
|---|---|---|---|
| Quadrant | BADHDUFLAG | Total packets | Discarded packets |
| A | 0 | 32 | 0 |
| B | 0 | 32 | 0 |
| C | 0 | 32 | 0 |
| D | 0 | 32 | 0 |
| Mode M0 | |||
|---|---|---|---|
| Quadrant | BADHDUFLAG | Total packets | Discarded packets |
| A | 0 | 54431 | 0 |
| B | 0 | 87291 | 0 |
| C | 0 | 59542 | 0 |
| D | 0 | 56329 | 0 |
| Mode SS | |||
|---|---|---|---|
| Quadrant | BADHDUFLAG | Total packets | Discarded packets |
| A | 0 | 460 | 0 |
| B | 0 | 460 | 0 |
| C | 0 | 460 | 0 |
| D | 0 | 460 | 0 |
| Quadrant | Total seconds | Saturated seconds | Saturation percentage |
|---|---|---|---|
| A | 22583 | 837 | 3.706328% |
| B | 22574 | 5353 | 23.713121% |
| C | 22574 | 1446 | 6.405599% |
| D | 22571 | 1001 | 4.434894% |
Noise dominated data is calculated using 1-second bins in cleaned event files. If a bin has >2000 counts, and if more than 50% of those come from <1% of pixels, then it is considered to be noise-dominated and hence unusable.
| Quadrant | # 1 sec bins | Bins with >0 counts | Bins with >2000 counts | High rate bins dominated by noise | Noise dominated (total time) | Noise dominated (detector-on time) | Marked lightcurve |
|---|---|---|---|---|---|---|---|
| A | 37002 | 22599 | 363 | 363 | 0.98% | 1.61% | 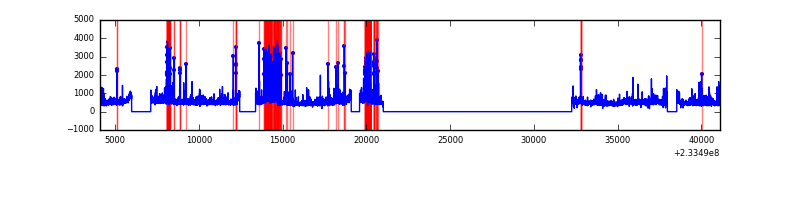 |
| B | 37002 | 22598 | 3859 | 3859 | 10.43% | 17.08% |  |
| C | 37002 | 22598 | 833 | 833 | 2.25% | 3.69% |  |
| D | 37002 | 22599 | 747 | 747 | 2.02% | 3.31% |  |
Top three noisy pixels from each quadrant. If the there are fewer than three noisy pixels in the level2.evt file, extra rows are filled as -1
| Pixel properties | Quadrant properties | ||||||
|---|---|---|---|---|---|---|---|
| Quadrant | DetID | PixID | Counts | Sigma | Mean | Median | Sigma |
| A | 8 | 5 | 1414101 | 2618.18 | 2656 | 2597 | 539.1 |
| A | 5 | 16 | 1244500 | 2303.59 | 2656 | 2597 | 539.1 |
| A | 13 | 251 | 520676 | 960.98 | 2656 | 2597 | 539.1 |
| B | 0 | 85 | 14133839 | 29535.82 | 2517 | 2459 | 478.4 |
| B | 4 | 173 | 87487 | 177.72 | 2517 | 2459 | 478.4 |
| B | 0 | 214 | 82245 | 166.76 | 2517 | 2459 | 478.4 |
| C | 4 | 254 | 4787017 | 8093.25 | 2559 | 2573 | 591.2 |
| C | 4 | 238 | 26142 | 39.87 | 2559 | 2573 | 591.2 |
| C | 13 | 61 | 19255 | 28.22 | 2559 | 2573 | 591.2 |
| D | 1 | 52 | 1800111 | 2607.73 | 2553 | 2506 | 689.3 |
| D | 13 | 29 | 659361 | 952.88 | 2553 | 2506 | 689.3 |
| D | 12 | 233 | 555881 | 802.77 | 2553 | 2506 | 689.3 |
Histogram calculated using DETX and DETY for each event in the final _common_clean file
| Quadrant A |  |
 |
Quadrant B |
|---|---|---|---|
| Quadrant D | 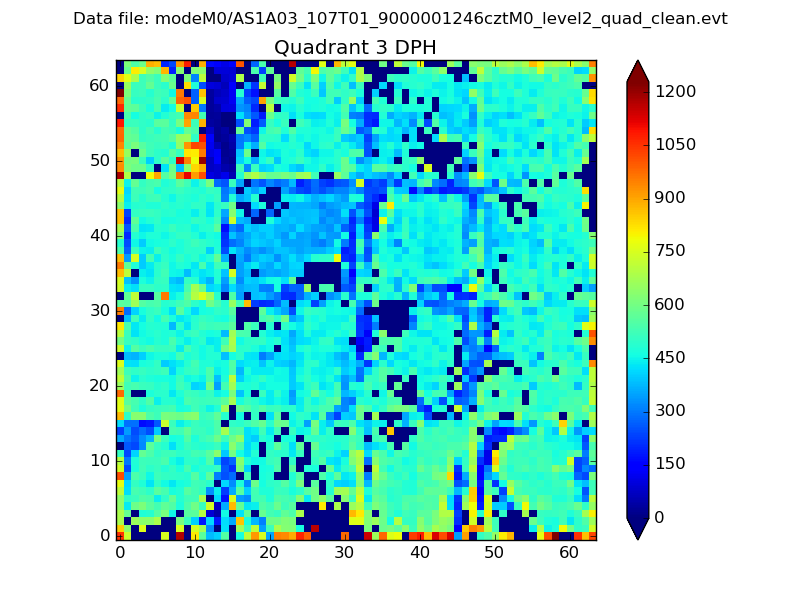 |
 |
Quadrant C |
| Plot type | Count rate plots | Images |
|---|---|---|
| Comparison with Poisson distribution Blue bars denote a histogram of data divided into 1 sec bins. Red curve is a Poisson curve with rate = median count rate of data. |
 |
 |
| Quadrant-wise count rates Data is divided into 100 sec bins |
 |
|
| Module-wise count rates for Quadrant A Data is divided into 100 sec bins |
 |
 |
| Module-wise count rates for Quadrant B Data is divided into 100 sec bins |
 |
 |
| Module-wise count rates for Quadrant C Data is divided into 100 sec bins |
 |
 |
| Module-wise count rates for Quadrant D Data is divided into 100 sec bins |
 |
 |
| Parameter | Plot |
|---|---|
| CZT HV Monitor |  |
| D_VDD |  |
| Temperature 1 |  |
| Veto HV Monitor |  |
| Veto LLD |  |
| Alpha Counter | 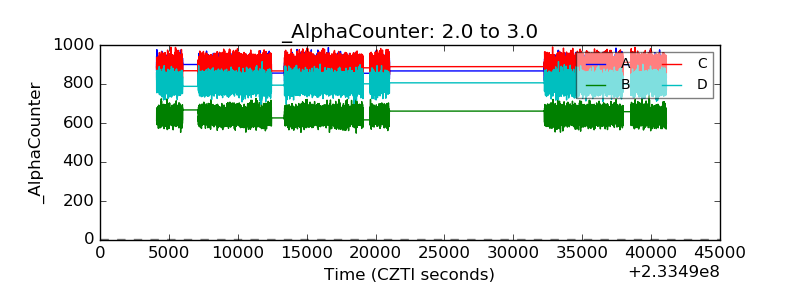 |
| _CPM_Rate |  |
| CZT Counter | 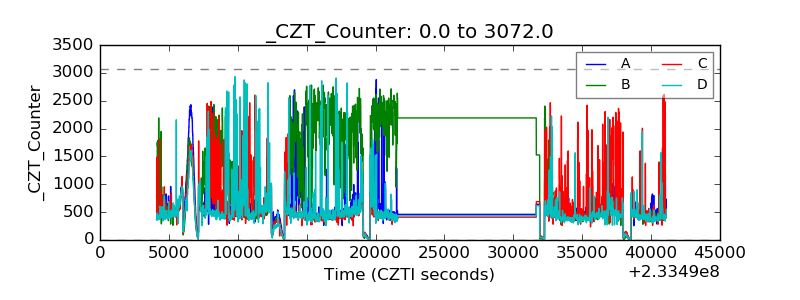 |
| +2.5 Volts monitor |  |
| +5 Volts monitor |  |
| _ROLL_ROT |  |
| _Roll_DEC | 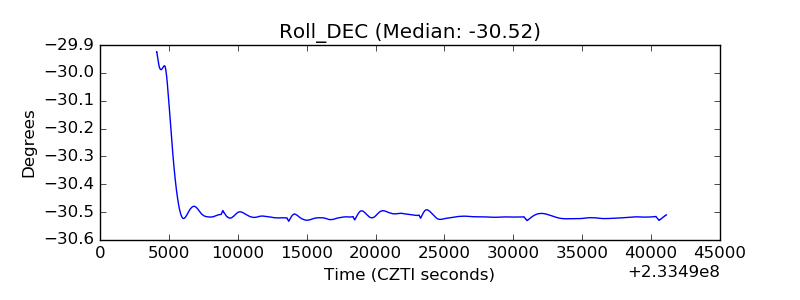 |
| _Roll_RA |  |
| Veto Counter |  |