| Param | Original file | Final file |
|---|---|---|
| Filename | modeM0/AS1A03_025T08_9000001248cztM0_level2_bc.evt | modeM0/AS1A03_025T08_9000001248cztM0_level2_quad_clean.evt |
| Size (bytes) | 1,664,928,000 | 602,841,600 |
| Size | 1.6 GB | 574.9 MB |
| Events in quadrant A | 12,986,207 | 3,843,816 |
| Events in quadrant B | 10,947,496 | 3,850,351 |
| Events in quadrant C | 12,021,308 | 3,640,813 |
| Events in quadrant D | 11,258,503 | 3,696,884 |
| Mode M9 | |||
|---|---|---|---|
| Quadrant | BADHDUFLAG | Total packets | Discarded packets |
| A | 0 | 99 | 0 |
| B | 0 | 99 | 0 |
| C | 0 | 99 | 0 |
| D | 0 | 99 | 0 |
| Mode M0 | |||
|---|---|---|---|
| Quadrant | BADHDUFLAG | Total packets | Discarded packets |
| A | 0 | 108752 | 0 |
| B | 0 | 103785 | 0 |
| C | 0 | 110764 | 0 |
| D | 0 | 101971 | 0 |
| Mode SS | |||
|---|---|---|---|
| Quadrant | BADHDUFLAG | Total packets | Discarded packets |
| A | 0 | 960 | 0 |
| B | 0 | 960 | 0 |
| C | 0 | 960 | 0 |
| D | 0 | 960 | 0 |
| Quadrant | Total seconds | Saturated seconds | Saturation percentage |
|---|---|---|---|
| A | 47017 | 1015 | 2.158794% |
| B | 47020 | 1252 | 2.662697% |
| C | 47015 | 2468 | 5.249388% |
| D | 47020 | 676 | 1.437686% |
Noise dominated data is calculated using 1-second bins in cleaned event files. If a bin has >2000 counts, and if more than 50% of those come from <1% of pixels, then it is considered to be noise-dominated and hence unusable.
| Quadrant | # 1 sec bins | Bins with >0 counts | Bins with >2000 counts | High rate bins dominated by noise | Noise dominated (total time) | Noise dominated (detector-on time) | Marked lightcurve |
|---|---|---|---|---|---|---|---|
| A | 67311 | 47026 | 16 | 16 | 0.02% | 0.03% |  |
| B | 67311 | 47019 | 26 | 26 | 0.04% | 0.06% |  |
| C | 67311 | 46997 | 70 | 70 | 0.10% | 0.15% |  |
| D | 67311 | 47027 | 74 | 74 | 0.11% | 0.16% |  |
Top three noisy pixels from each quadrant. If the there are fewer than three noisy pixels in the level2.evt file, extra rows are filled as -1
| Pixel properties | Quadrant properties | ||||||
|---|---|---|---|---|---|---|---|
| Quadrant | DetID | PixID | Counts | Sigma | Mean | Median | Sigma |
| A | 8 | 5 | 3221583 | 6061.03 | 2456 | 2408 | 531.1 |
| A | 15 | 174 | 218143 | 406.18 | 2456 | 2408 | 531.1 |
| A | 5 | 16 | 52012 | 93.39 | 2456 | 2408 | 531.1 |
| B | 10 | 16 | 693793 | 1480.57 | 2470 | 2398 | 467.0 |
| B | 12 | 32 | 284876 | 604.91 | 2470 | 2398 | 467.0 |
| B | 0 | 219 | 149204 | 314.37 | 2470 | 2398 | 467.0 |
| C | 4 | 254 | 2774897 | 5496.04 | 2327 | 2291 | 504.5 |
| C | 14 | 234 | 90547 | 174.95 | 2327 | 2291 | 504.5 |
| C | 9 | 68 | 33539 | 61.94 | 2327 | 2291 | 504.5 |
| D | 1 | 52 | 1019936 | 1769.0 | 2393 | 2317 | 575.3 |
| D | 7 | 71 | 339616 | 586.35 | 2393 | 2317 | 575.3 |
| D | 2 | 14 | 191753 | 329.31 | 2393 | 2317 | 575.3 |
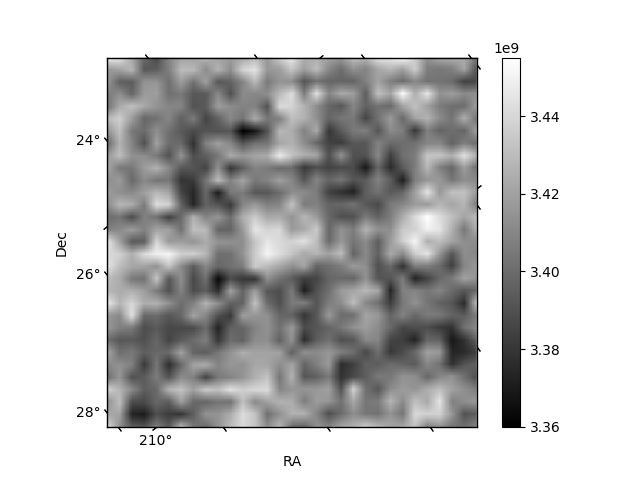
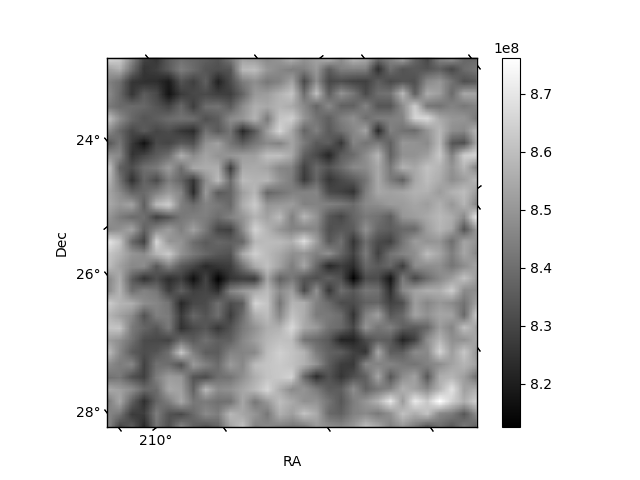
Histogram calculated using DETX and DETY for each event in the final _common_clean file
| Quadrant A |  |
 |
Quadrant B |
|---|---|---|---|
| Quadrant D |  |
 |
Quadrant C |
| Plot type | Count rate plots | Images |
|---|---|---|
| Comparison with Poisson distribution Blue bars denote a histogram of data divided into 1 sec bins. Red curve is a Poisson curve with rate = median count rate of data. |
 |
 |
| Quadrant-wise count rates Data is divided into 100 sec bins |
 |
|
| Module-wise count rates for Quadrant A Data is divided into 100 sec bins |
 |
 |
| Module-wise count rates for Quadrant B Data is divided into 100 sec bins |
 |
 |
| Module-wise count rates for Quadrant C Data is divided into 100 sec bins |
 |
 |
| Module-wise count rates for Quadrant D Data is divided into 100 sec bins |
 |
 |
| Parameter | Plot |
|---|---|
| CZT HV Monitor |  |
| D_VDD | 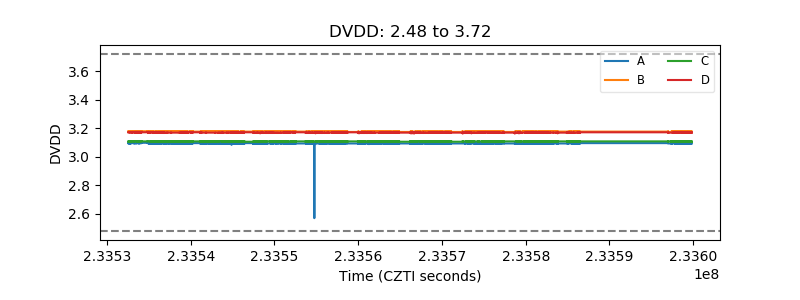 |
| Temperature 1 |  |
| Veto HV Monitor |  |
| Veto LLD |  |
| Alpha Counter |  |
| _CPM_Rate |  |
| CZT Counter |  |
| +2.5 Volts monitor |  |
| +5 Volts monitor | 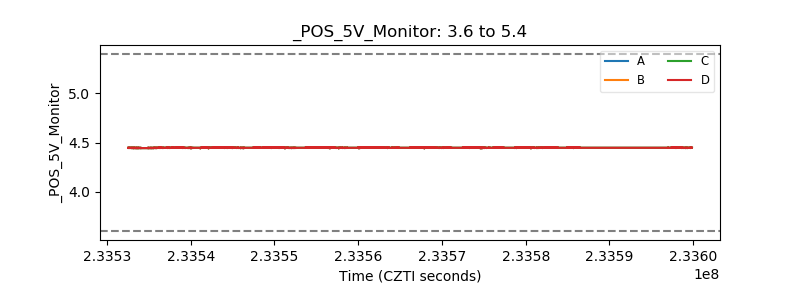 |
| _ROLL_ROT | 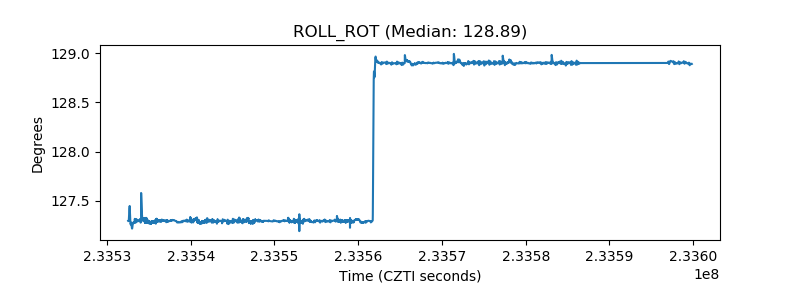 |
| _Roll_DEC |  |
| _Roll_RA |  |
| Veto Counter |  |