| Param | Original file | Final file |
|---|---|---|
| Filename | modeM0/AS1G07_019T01_9000001244cztM0_level2.evt | modeM0/AS1G07_019T01_9000001244cztM0_level2_quad_clean.evt |
| Size (bytes) | 4,532,702,400 | 743,578,560 |
| Size | 4.2 GB | 709.1 MB |
| Events in quadrant A | 33,276,982 | 4,731,568 |
| Events in quadrant B | 34,678,667 | 4,697,268 |
| Events in quadrant C | 28,367,687 | 4,688,807 |
| Events in quadrant D | 37,047,967 | 4,430,598 |
| Mode M9 | |||
|---|---|---|---|
| Quadrant | BADHDUFLAG | Total packets | Discarded packets |
| A | 0 | 91 | 0 |
| B | 0 | 91 | 0 |
| C | 0 | 91 | 0 |
| D | 0 | 91 | 0 |
| Mode M0 | |||
|---|---|---|---|
| Quadrant | BADHDUFLAG | Total packets | Discarded packets |
| A | 0 | 137252 | 0 |
| B | 0 | 141053 | 0 |
| C | 0 | 124349 | 0 |
| D | 0 | 148649 | 0 |
| Mode SS | |||
|---|---|---|---|
| Quadrant | BADHDUFLAG | Total packets | Discarded packets |
| A | 0 | 1182 | 0 |
| B | 0 | 1182 | 0 |
| C | 0 | 1182 | 0 |
| D | 0 | 1182 | 0 |
| Quadrant | Total seconds | Saturated seconds | Saturation percentage |
|---|---|---|---|
| A | 57917 | 1091 | 1.883730% |
| B | 57917 | 2623 | 4.528895% |
| C | 57917 | 825 | 1.424452% |
| D | 57916 | 2720 | 4.696457% |
Noise dominated data is calculated using 1-second bins in cleaned event files. If a bin has >2000 counts, and if more than 50% of those come from <1% of pixels, then it is considered to be noise-dominated and hence unusable.
| Quadrant | # 1 sec bins | Bins with >0 counts | Bins with >2000 counts | High rate bins dominated by noise | Noise dominated (total time) | Noise dominated (detector-on time) | Marked lightcurve |
|---|---|---|---|---|---|---|---|
| A | 67008 | 57927 | 354 | 354 | 0.53% | 0.61% |  |
| B | 67008 | 57924 | 1593 | 1593 | 2.38% | 2.75% |  |
| C | 67008 | 57928 | 321 | 321 | 0.48% | 0.55% |  |
| D | 67008 | 57926 | 2233 | 2233 | 3.33% | 3.85% |  |
Top three noisy pixels from each quadrant. If the there are fewer than three noisy pixels in the level2.evt file, extra rows are filled as -1
| Pixel properties | Quadrant properties | ||||||
|---|---|---|---|---|---|---|---|
| Quadrant | DetID | PixID | Counts | Sigma | Mean | Median | Sigma |
| A | 8 | 5 | 5134744 | 3691.79 | 6903 | 6754 | 1389.0 |
| A | 5 | 16 | 811663 | 579.48 | 6903 | 6754 | 1389.0 |
| A | 15 | 174 | 619116 | 440.86 | 6903 | 6754 | 1389.0 |
| B | 10 | 16 | 4083094 | 3186.41 | 6840 | 6671 | 1279.3 |
| B | 0 | 85 | 1974212 | 1537.96 | 6840 | 6671 | 1279.3 |
| B | 10 | 252 | 887034 | 688.15 | 6840 | 6671 | 1279.3 |
| C | 4 | 254 | 2218710 | 1445.23 | 6679 | 6711 | 1530.5 |
| C | 13 | 61 | 51153 | 29.04 | 6679 | 6711 | 1530.5 |
| C | 14 | 234 | 34539 | 18.18 | 6679 | 6711 | 1530.5 |
| D | 1 | 52 | 3404432 | 1962.58 | 6550 | 6403 | 1731.4 |
| D | 13 | 29 | 3211634 | 1851.23 | 6550 | 6403 | 1731.4 |
| D | 8 | 195 | 1568435 | 902.17 | 6550 | 6403 | 1731.4 |
Histogram calculated using DETX and DETY for each event in the final _common_clean file
| Quadrant A |  |
 |
Quadrant B |
|---|---|---|---|
| Quadrant D | 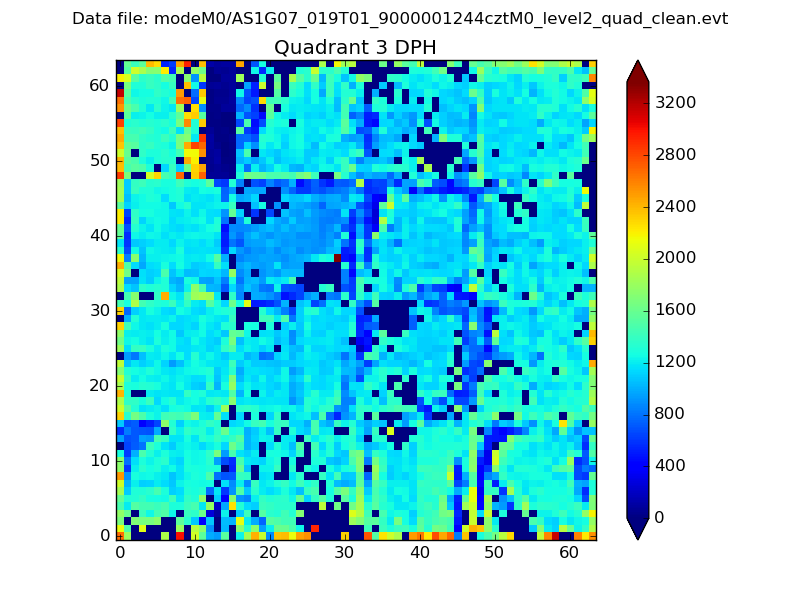 |
 |
Quadrant C |
| Plot type | Count rate plots | Images |
|---|---|---|
| Comparison with Poisson distribution Blue bars denote a histogram of data divided into 1 sec bins. Red curve is a Poisson curve with rate = median count rate of data. |
 |
 |
| Quadrant-wise count rates Data is divided into 100 sec bins |
 |
|
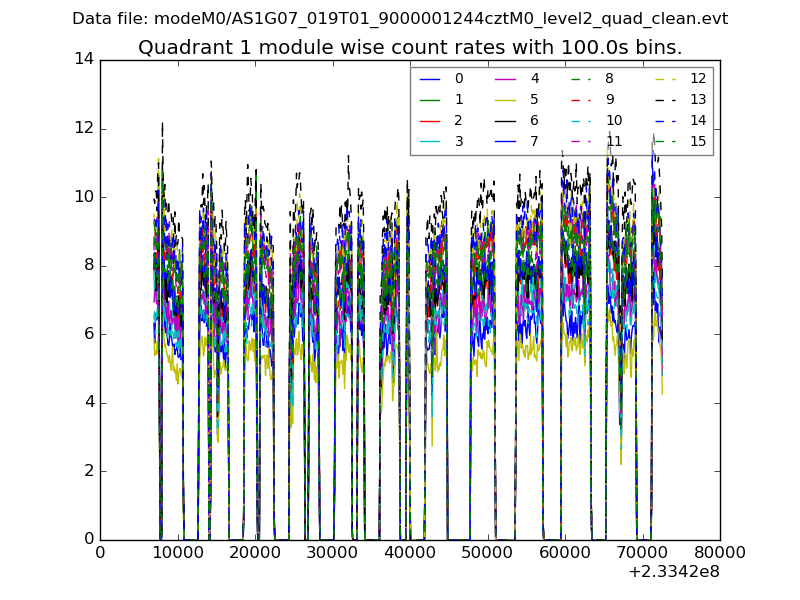
| Module-wise count rates for Quadrant A Data is divided into 100 sec bins |
 |
 |
| Module-wise count rates for Quadrant B Data is divided into 100 sec bins |
 |
 |
| Module-wise count rates for Quadrant C Data is divided into 100 sec bins |
 |
 |
| Module-wise count rates for Quadrant D Data is divided into 100 sec bins |
 |
 |
| Parameter | Plot |
|---|---|
| CZT HV Monitor |  |
| D_VDD |  |
| Temperature 1 | 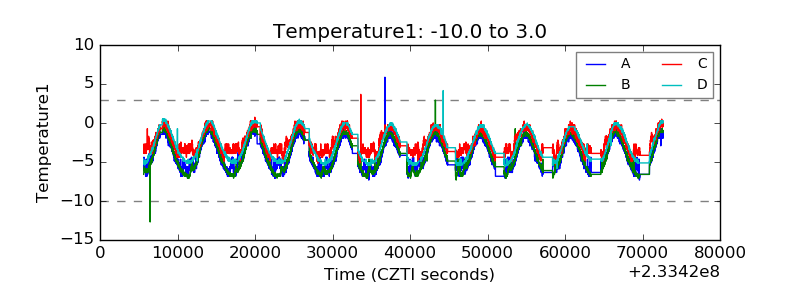 |
| Veto HV Monitor |  |
| Veto LLD |  |
| Alpha Counter |  |
| _CPM_Rate |  |
| CZT Counter | 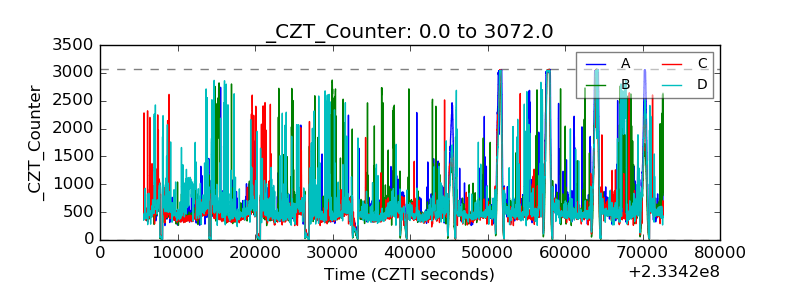 |
| +2.5 Volts monitor |  |
| +5 Volts monitor | 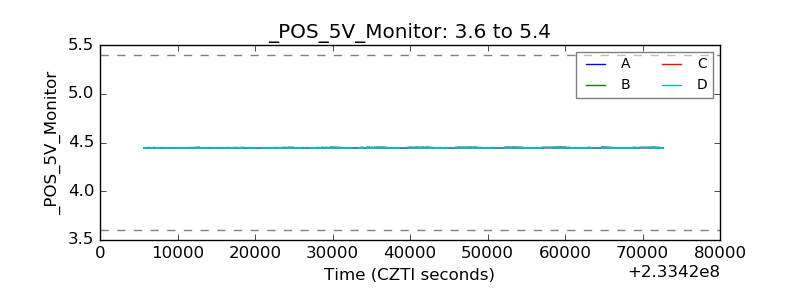 |
| _ROLL_ROT |  |
| _Roll_DEC |  |
| _Roll_RA |  |
| Veto Counter |  |