| Param | Original file | Final file |
|---|---|---|
| Filename | modeM0/AS1A03_051T01_9000001242cztM0_level2_bc.evt | modeM0/AS1A03_051T01_9000001242cztM0_level2_quad_clean.evt |
| Size (bytes) | 2,224,206,720 | 762,768,000 |
| Size | 2.1 GB | 727.4 MB |
| Events in quadrant A | 17,182,126 | 4,774,476 |
| Events in quadrant B | 12,676,540 | 4,865,846 |
| Events in quadrant C | 13,904,378 | 4,726,542 |
| Events in quadrant D | 19,466,875 | 4,580,303 |
| Mode M9 | |||
|---|---|---|---|
| Quadrant | BADHDUFLAG | Total packets | Discarded packets |
| A | 0 | 97 | 0 |
| B | 0 | 97 | 0 |
| C | 0 | 97 | 0 |
| D | 0 | 97 | 0 |
| Mode M0 | |||
|---|---|---|---|
| Quadrant | BADHDUFLAG | Total packets | Discarded packets |
| A | 0 | 139940 | 0 |
| B | 0 | 125594 | 0 |
| C | 0 | 133568 | 0 |
| D | 0 | 144592 | 0 |
| Mode SS | |||
|---|---|---|---|
| Quadrant | BADHDUFLAG | Total packets | Discarded packets |
| A | 0 | 1242 | 0 |
| B | 0 | 1244 | 0 |
| C | 0 | 1236 | 0 |
| D | 0 | 1242 | 0 |
| Quadrant | Total seconds | Saturated seconds | Saturation percentage |
|---|---|---|---|
| A | 60569 | 1177 | 1.943238% |
| B | 60577 | 544 | 0.898031% |
| C | 60563 | 1499 | 2.475109% |
| D | 60553 | 1607 | 2.653873% |
Noise dominated data is calculated using 1-second bins in cleaned event files. If a bin has >2000 counts, and if more than 50% of those come from <1% of pixels, then it is considered to be noise-dominated and hence unusable.
| Quadrant | # 1 sec bins | Bins with >0 counts | Bins with >2000 counts | High rate bins dominated by noise | Noise dominated (total time) | Noise dominated (detector-on time) | Marked lightcurve |
|---|---|---|---|---|---|---|---|
| A | 76152 | 60803 | 170 | 170 | 0.22% | 0.28% |  |
| B | 76152 | 60808 | 4 | 4 | 0.01% | 0.01% |  |
| C | 76152 | 60795 | 66 | 66 | 0.09% | 0.11% |  |
| D | 76152 | 60791 | 380 | 380 | 0.50% | 0.63% |  |
Top three noisy pixels from each quadrant. If the there are fewer than three noisy pixels in the level2.evt file, extra rows are filled as -1
| Pixel properties | Quadrant properties | ||||||
|---|---|---|---|---|---|---|---|
| Quadrant | DetID | PixID | Counts | Sigma | Mean | Median | Sigma |
| A | 8 | 5 | 3285328 | 4887.38 | 3064 | 3001 | 671.6 |
| A | 5 | 16 | 1821661 | 2707.98 | 3064 | 3001 | 671.6 |
| A | 15 | 174 | 124350 | 180.69 | 3064 | 3001 | 671.6 |
| B | 0 | 214 | 171145 | 281.1 | 3107 | 3016 | 598.1 |
| B | 4 | 173 | 148964 | 244.02 | 3107 | 3016 | 598.1 |
| B | 6 | 51 | 104131 | 169.06 | 3107 | 3016 | 598.1 |
| C | 4 | 254 | 2278072 | 3535.0 | 2963 | 2918 | 643.6 |
| C | 14 | 234 | 26410 | 36.5 | 2963 | 2918 | 643.6 |
| C | 13 | 61 | 18353 | 23.98 | 2963 | 2918 | 643.6 |
| D | 8 | 195 | 2008737 | 2736.14 | 2990 | 2897 | 733.1 |
| D | 1 | 52 | 1725139 | 2349.29 | 2990 | 2897 | 733.1 |
| D | 13 | 104 | 1589155 | 2163.79 | 2990 | 2897 | 733.1 |
Histogram calculated using DETX and DETY for each event in the final _common_clean file
| Quadrant A |  |
 |
Quadrant B |
|---|---|---|---|
| Quadrant D |  |
 |
Quadrant C |
| Plot type | Count rate plots | Images |
|---|---|---|
| Comparison with Poisson distribution Blue bars denote a histogram of data divided into 1 sec bins. Red curve is a Poisson curve with rate = median count rate of data. |
 |
 |
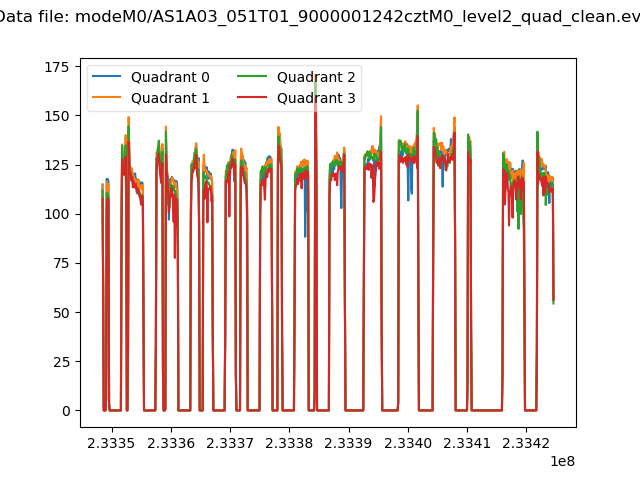
| Quadrant-wise count rates Data is divided into 100 sec bins |
 |
|
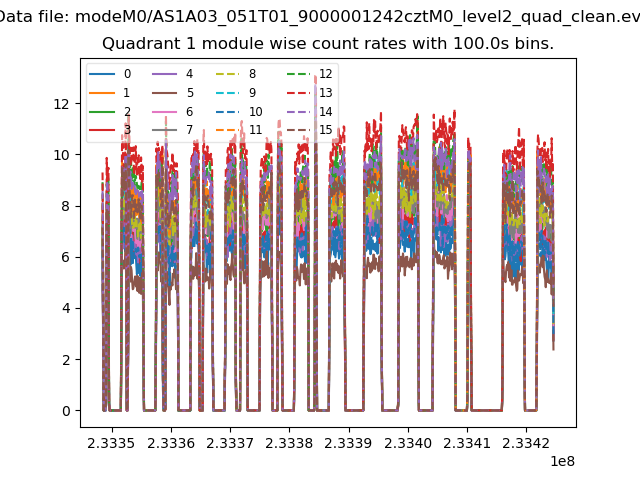
| Module-wise count rates for Quadrant A Data is divided into 100 sec bins |
 |
 |
| Module-wise count rates for Quadrant B Data is divided into 100 sec bins |
 |
 |
| Module-wise count rates for Quadrant C Data is divided into 100 sec bins |
 |
 |
| Module-wise count rates for Quadrant D Data is divided into 100 sec bins |
 |
 |
| Parameter | Plot |
|---|---|
| CZT HV Monitor | 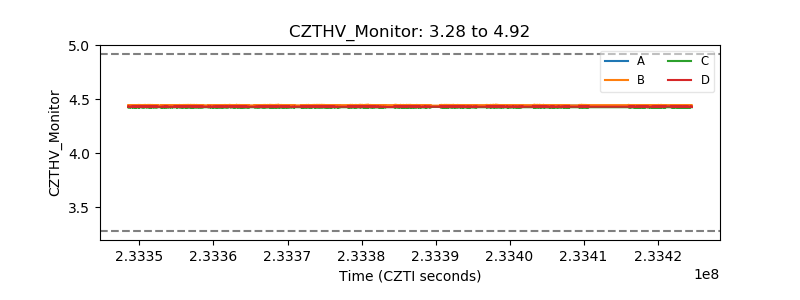 |
| D_VDD |  |
| Temperature 1 |  |
| Veto HV Monitor |  |
| Veto LLD |  |
| Alpha Counter |  |
| _CPM_Rate |  |
| CZT Counter |  |
| +2.5 Volts monitor |  |
| +5 Volts monitor | 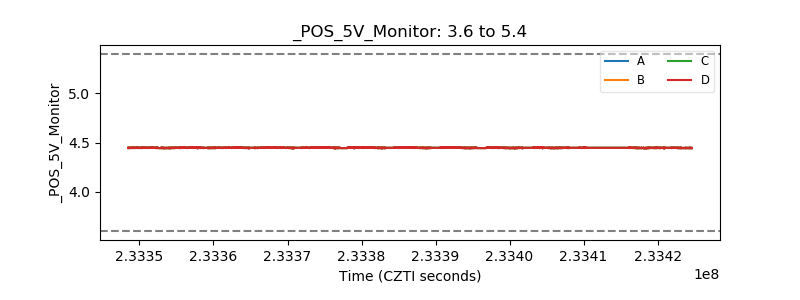 |
| _ROLL_ROT |  |
| _Roll_DEC |  |
| _Roll_RA |  |
| Veto Counter |  |