| Param | Original file | Final file |
|---|---|---|
| Filename | modeM0/AS1G07_046T01_9000001236cztM0_level2.evt | modeM0/AS1G07_046T01_9000001236cztM0_level2_quad_clean.evt |
| Size (bytes) | 3,155,512,320 | 486,745,920 |
| Size | 2.9 GB | 464.2 MB |
| Events in quadrant A | 21,746,617 | 3,096,468 |
| Events in quadrant B | 29,249,744 | 2,975,251 |
| Events in quadrant C | 21,035,663 | 3,068,371 |
| Events in quadrant D | 20,972,375 | 2,991,041 |
| Mode M0 | |||
|---|---|---|---|
| Quadrant | BADHDUFLAG | Total packets | Discarded packets |
| A | 0 | 89261 | 0 |
| B | 0 | 111777 | 0 |
| C | 0 | 86749 | 0 |
| D | 0 | 86312 | 0 |
| Mode M9 | |||
|---|---|---|---|
| Quadrant | BADHDUFLAG | Total packets | Discarded packets |
| A | 0 | 75 | 0 |
| B | 0 | 75 | 0 |
| C | 0 | 75 | 0 |
| D | 0 | 75 | 0 |
| Mode SS | |||
|---|---|---|---|
| Quadrant | BADHDUFLAG | Total packets | Discarded packets |
| A | 0 | 782 | 0 |
| B | 0 | 782 | 0 |
| C | 0 | 782 | 0 |
| D | 0 | 782 | 0 |
| Quadrant | Total seconds | Saturated seconds | Saturation percentage |
|---|---|---|---|
| A | 38004 | 830 | 2.183981% |
| B | 38007 | 3901 | 10.263899% |
| C | 38005 | 606 | 1.594527% |
| D | 38006 | 729 | 1.918118% |
Noise dominated data is calculated using 1-second bins in cleaned event files. If a bin has >2000 counts, and if more than 50% of those come from <1% of pixels, then it is considered to be noise-dominated and hence unusable.
| Quadrant | # 1 sec bins | Bins with >0 counts | Bins with >2000 counts | High rate bins dominated by noise | Noise dominated (total time) | Noise dominated (detector-on time) | Marked lightcurve |
|---|---|---|---|---|---|---|---|
| A | 45666 | 38013 | 119 | 119 | 0.26% | 0.31% |  |
| B | 45666 | 38013 | 2900 | 2900 | 6.35% | 7.63% | 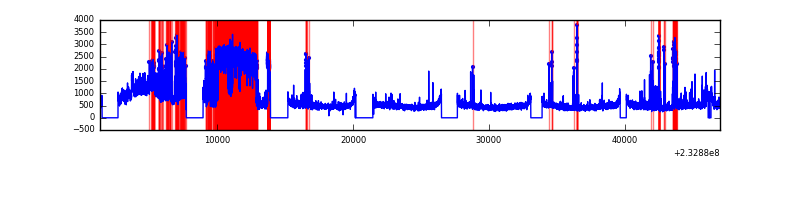 |
| C | 45666 | 38014 | 149 | 149 | 0.33% | 0.39% |  |
| D | 45666 | 38012 | 241 | 241 | 0.53% | 0.63% |  |
Top three noisy pixels from each quadrant. If the there are fewer than three noisy pixels in the level2.evt file, extra rows are filled as -1
| Pixel properties | Quadrant properties | ||||||
|---|---|---|---|---|---|---|---|
| Quadrant | DetID | PixID | Counts | Sigma | Mean | Median | Sigma |
| A | 8 | 5 | 2784839 | 2859.67 | 4815 | 4720 | 972.2 |
| A | 15 | 174 | 287100 | 290.46 | 4815 | 4720 | 972.2 |
| A | 5 | 16 | 103084 | 101.18 | 4815 | 4720 | 972.2 |
| B | 7 | 202 | 9341325 | 10647.96 | 4645 | 4538 | 876.9 |
| B | 4 | 48 | 1094046 | 1242.51 | 4645 | 4538 | 876.9 |
| B | 10 | 16 | 492998 | 557.05 | 4645 | 4538 | 876.9 |
| C | 9 | 68 | 2623055 | 2431.11 | 4683 | 4717 | 1077.0 |
| C | 14 | 234 | 77644 | 67.71 | 4683 | 4717 | 1077.0 |
| C | 1 | 3 | 56898 | 48.45 | 4683 | 4717 | 1077.0 |
| D | 8 | 195 | 1658409 | 1463.48 | 4669 | 4571 | 1130.1 |
| D | 7 | 71 | 633943 | 556.93 | 4669 | 4571 | 1130.1 |
| D | 1 | 52 | 532501 | 467.16 | 4669 | 4571 | 1130.1 |
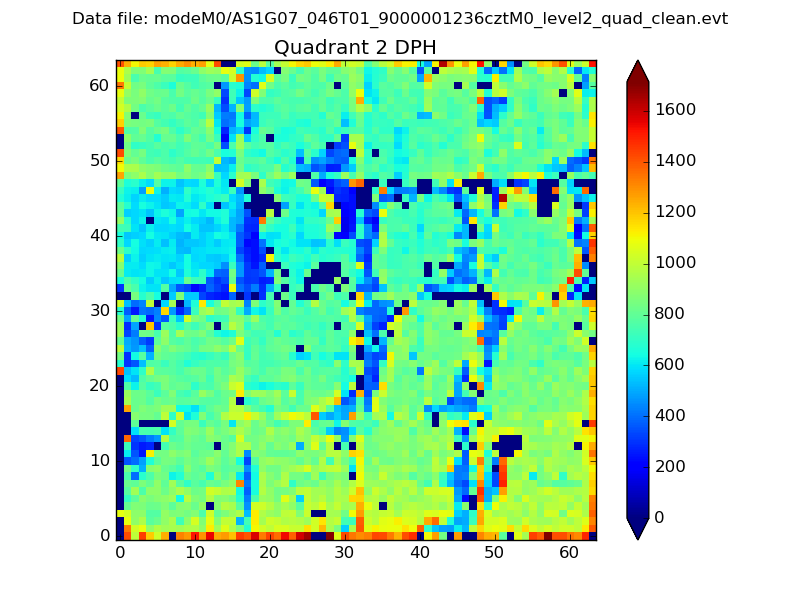
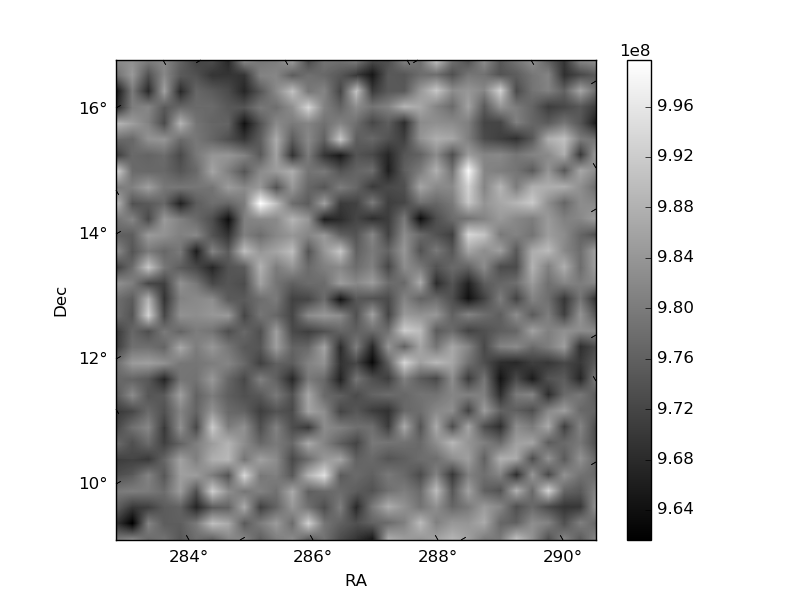
Histogram calculated using DETX and DETY for each event in the final _common_clean file
| Quadrant A |  |
 |
Quadrant B |
|---|---|---|---|
| Quadrant D |  |
 |
Quadrant C |
| Plot type | Count rate plots | Images |
|---|---|---|
| Comparison with Poisson distribution Blue bars denote a histogram of data divided into 1 sec bins. Red curve is a Poisson curve with rate = median count rate of data. |
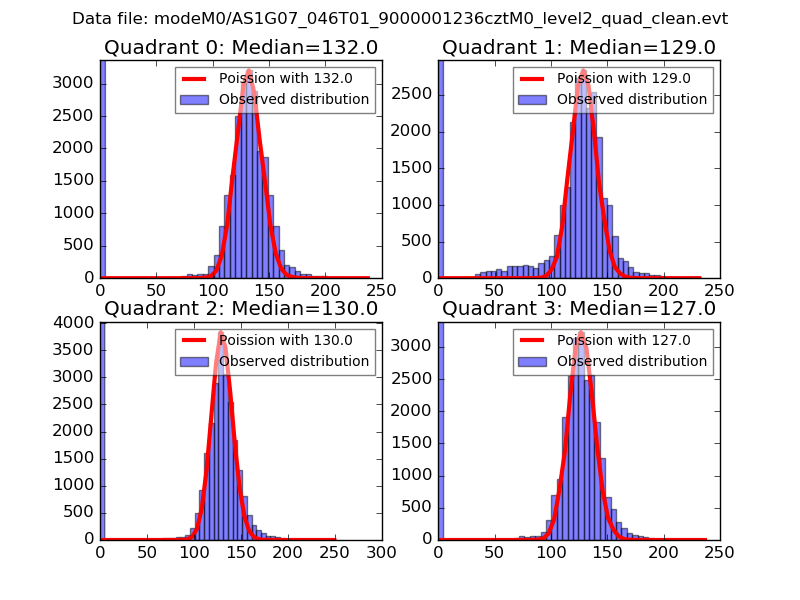 |
 |
| Quadrant-wise count rates Data is divided into 100 sec bins |
 |
|
| Module-wise count rates for Quadrant A Data is divided into 100 sec bins |
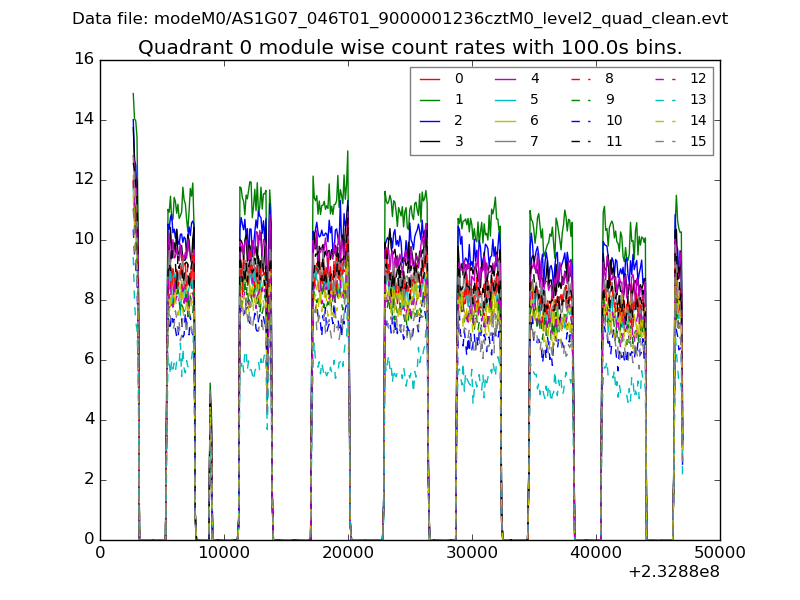 |
 |
| Module-wise count rates for Quadrant B Data is divided into 100 sec bins |
 |
 |
| Module-wise count rates for Quadrant C Data is divided into 100 sec bins |
 |
 |
| Module-wise count rates for Quadrant D Data is divided into 100 sec bins |
 |
 |
| Parameter | Plot |
|---|---|
| CZT HV Monitor | 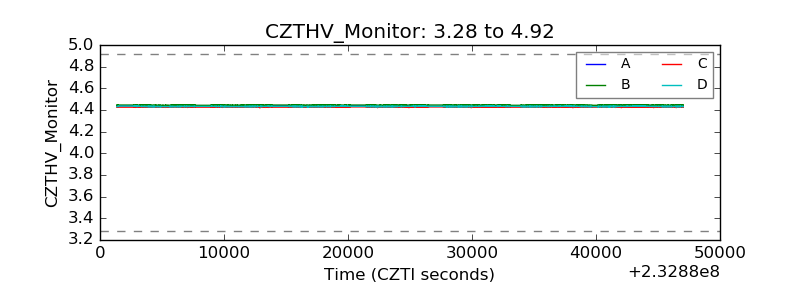 |
| D_VDD |  |
| Temperature 1 |  |
| Veto HV Monitor | 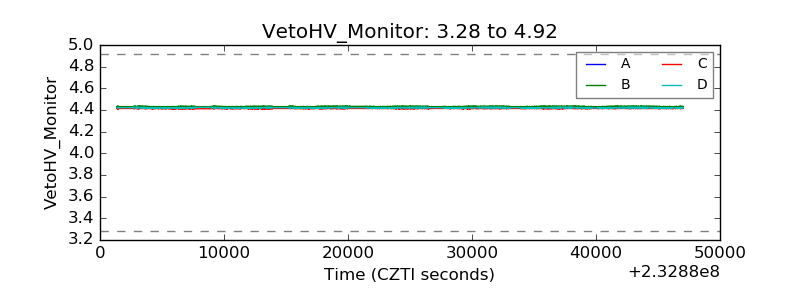 |
| Veto LLD |  |
| Alpha Counter |  |
| _CPM_Rate |  |
| CZT Counter |  |
| +2.5 Volts monitor | 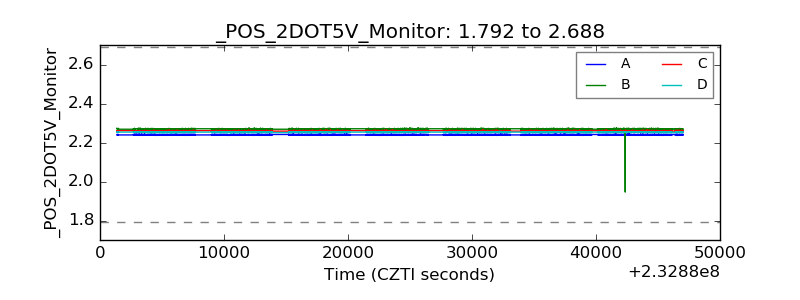 |
| +5 Volts monitor |  |
| _ROLL_ROT |  |
| _Roll_DEC | 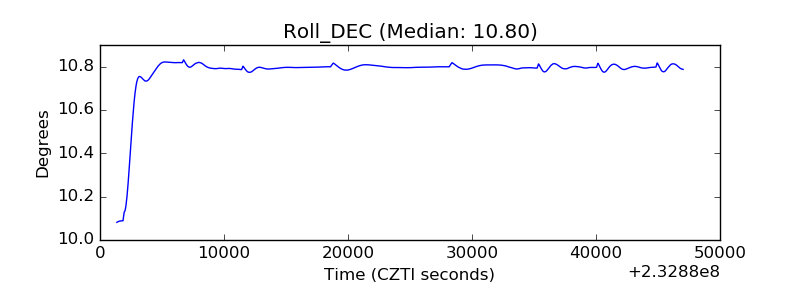 |
| _Roll_RA |  |
| Veto Counter |  |