| Param | Original file | Final file |
|---|---|---|
| Filename | modeM0/AS1A03_065T01_9000001238cztM0_level2.evt | modeM0/AS1A03_065T01_9000001238cztM0_level2_quad_clean.evt |
| Size (bytes) | 2,904,672,960 | 476,876,160 |
| Size | 2.7 GB | 454.8 MB |
| Events in quadrant A | 24,446,314 | 2,931,030 |
| Events in quadrant B | 18,966,202 | 2,997,705 |
| Events in quadrant C | 19,261,077 | 2,933,237 |
| Events in quadrant D | 22,607,047 | 2,845,255 |
| Mode SS | |||
|---|---|---|---|
| Quadrant | BADHDUFLAG | Total packets | Discarded packets |
| A | 0 | 812 | 0 |
| B | 0 | 812 | 0 |
| C | 0 | 812 | 0 |
| D | 0 | 812 | 0 |
| Mode M0 | |||
|---|---|---|---|
| Quadrant | BADHDUFLAG | Total packets | Discarded packets |
| A | 0 | 98665 | 0 |
| B | 0 | 82387 | 0 |
| C | 0 | 83799 | 0 |
| D | 0 | 92983 | 0 |
| Mode M9 | |||
|---|---|---|---|
| Quadrant | BADHDUFLAG | Total packets | Discarded packets |
| A | 0 | 56 | 0 |
| B | 0 | 56 | 0 |
| C | 0 | 56 | 0 |
| D | 0 | 56 | 0 |
| Quadrant | Total seconds | Saturated seconds | Saturation percentage |
|---|---|---|---|
| A | 39847 | 700 | 1.756719% |
| B | 39851 | 357 | 0.895837% |
| C | 39857 | 257 | 0.644805% |
| D | 39850 | 644 | 1.616060% |
Noise dominated data is calculated using 1-second bins in cleaned event files. If a bin has >2000 counts, and if more than 50% of those come from <1% of pixels, then it is considered to be noise-dominated and hence unusable.
| Quadrant | # 1 sec bins | Bins with >0 counts | Bins with >2000 counts | High rate bins dominated by noise | Noise dominated (total time) | Noise dominated (detector-on time) | Marked lightcurve |
|---|---|---|---|---|---|---|---|
| A | 45460 | 39867 | 300 | 300 | 0.66% | 0.75% | 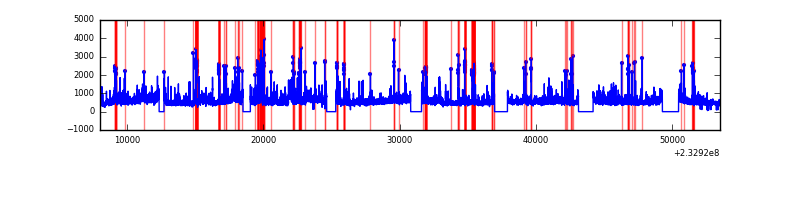 |
| B | 45460 | 39867 | 22 | 22 | 0.05% | 0.06% |  |
| C | 45460 | 39868 | 44 | 44 | 0.10% | 0.11% |  |
| D | 45460 | 39867 | 392 | 392 | 0.86% | 0.98% |  |
Top three noisy pixels from each quadrant. If the there are fewer than three noisy pixels in the level2.evt file, extra rows are filled as -1
| Pixel properties | Quadrant properties | ||||||
|---|---|---|---|---|---|---|---|
| Quadrant | DetID | PixID | Counts | Sigma | Mean | Median | Sigma |
| A | 8 | 5 | 4718829 | 4914.81 | 4758 | 4653 | 959.2 |
| A | 15 | 174 | 1142126 | 1185.88 | 4758 | 4653 | 959.2 |
| A | 5 | 16 | 207198 | 211.17 | 4758 | 4653 | 959.2 |
| B | 10 | 16 | 207904 | 223.78 | 4783 | 4665 | 908.2 |
| B | 12 | 111 | 103257 | 108.55 | 4783 | 4665 | 908.2 |
| B | 11 | 111 | 83410 | 86.7 | 4783 | 4665 | 908.2 |
| C | 9 | 68 | 997321 | 930.27 | 4625 | 4650 | 1067.1 |
| C | 14 | 234 | 113752 | 102.24 | 4625 | 4650 | 1067.1 |
| C | 10 | 22 | 59490 | 51.39 | 4625 | 4650 | 1067.1 |
| D | 8 | 195 | 2505876 | 2246.88 | 4601 | 4490 | 1113.3 |
| D | 2 | 152 | 748392 | 668.21 | 4601 | 4490 | 1113.3 |
| D | 1 | 52 | 520363 | 463.38 | 4601 | 4490 | 1113.3 |
Histogram calculated using DETX and DETY for each event in the final _common_clean file
| Quadrant A | 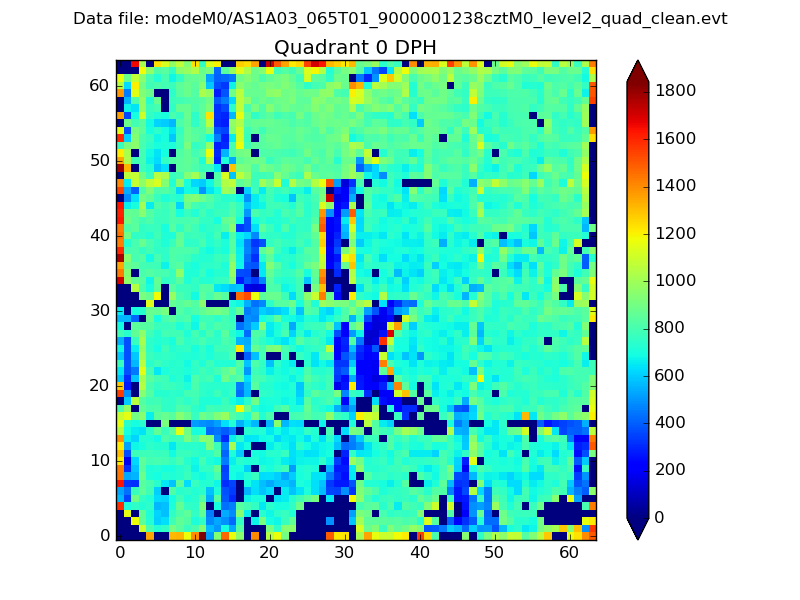 |
 |
Quadrant B |
|---|---|---|---|
| Quadrant D | 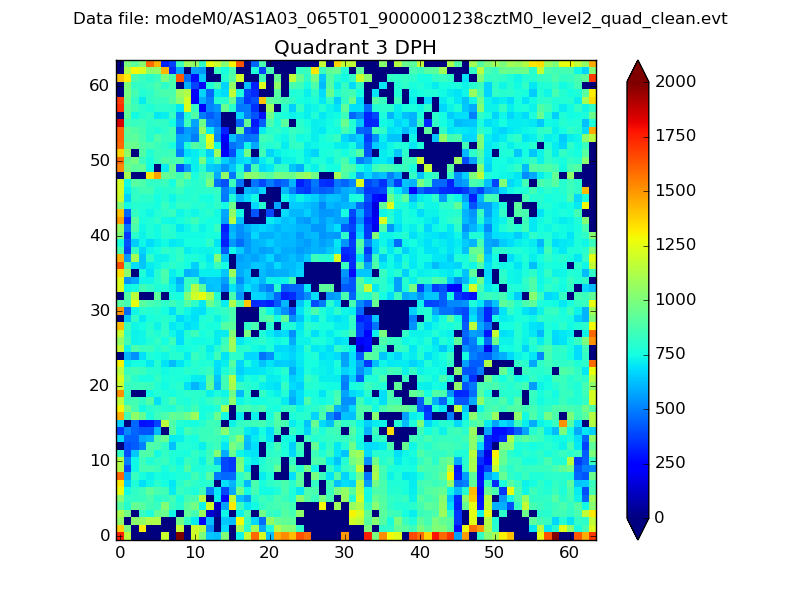 |
 |
Quadrant C |
| Plot type | Count rate plots | Images |
|---|---|---|
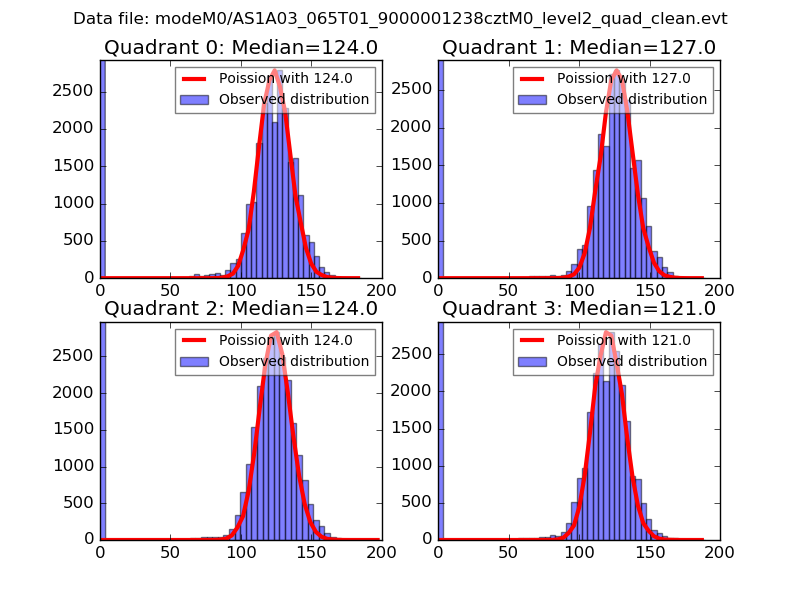
| Comparison with Poisson distribution Blue bars denote a histogram of data divided into 1 sec bins. Red curve is a Poisson curve with rate = median count rate of data. |
 |
 |
| Quadrant-wise count rates Data is divided into 100 sec bins |
 |
|
| Module-wise count rates for Quadrant A Data is divided into 100 sec bins |
 |
 |
| Module-wise count rates for Quadrant B Data is divided into 100 sec bins |
 |
 |
| Module-wise count rates for Quadrant C Data is divided into 100 sec bins |
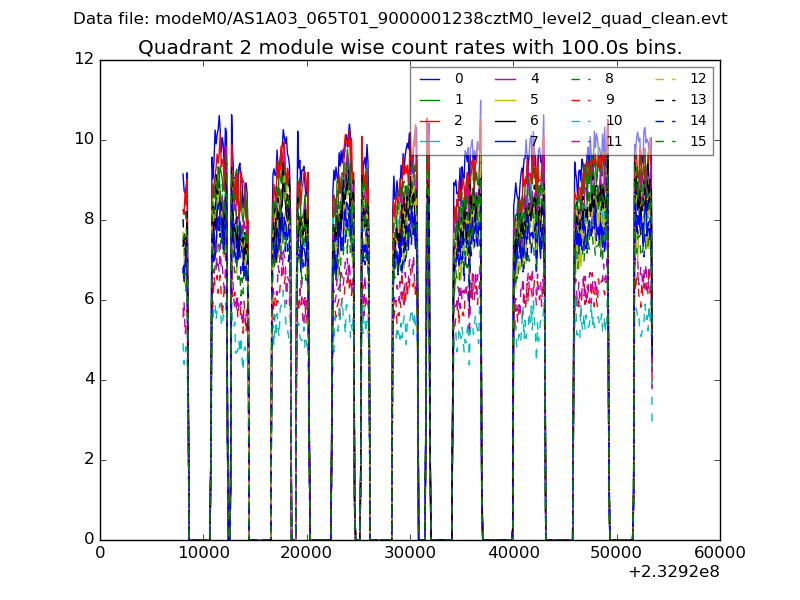 |
 |
| Module-wise count rates for Quadrant D Data is divided into 100 sec bins |
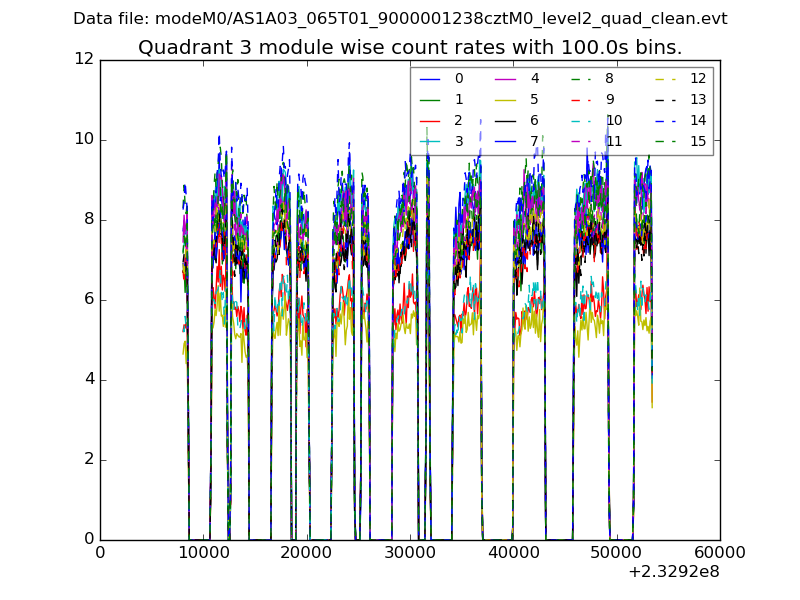 |
 |
| Parameter | Plot |
|---|---|
| CZT HV Monitor |  |
| D_VDD |  |
| Temperature 1 |  |
| Veto HV Monitor |  |
| Veto LLD | 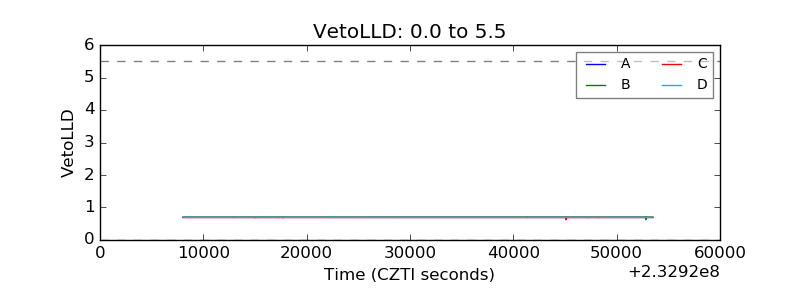 |
| Alpha Counter |  |
| _CPM_Rate |  |
| CZT Counter |  |
| +2.5 Volts monitor |  |
| +5 Volts monitor |  |
| _ROLL_ROT |  |
| _Roll_DEC |  |
| _Roll_RA |  |
| Veto Counter |  |