| Param | Original file | Final file |
|---|---|---|
| Filename | modeM0/AS1G07_028T01_9000001232cztM0_level2.evt | modeM0/AS1G07_028T01_9000001232cztM0_level2_quad_clean.evt |
| Size (bytes) | 1,178,095,680 | 200,373,120 |
| Size | 1.1 GB | 191.1 MB |
| Events in quadrant A | 9,287,713 | 1,248,645 |
| Events in quadrant B | 8,822,253 | 1,242,617 |
| Events in quadrant C | 7,541,260 | 1,241,039 |
| Events in quadrant D | 8,917,333 | 1,204,654 |
| Mode SS | |||
|---|---|---|---|
| Quadrant | BADHDUFLAG | Total packets | Discarded packets |
| A | 0 | 324 | 0 |
| B | 0 | 340 | 0 |
| C | 0 | 332 | 0 |
| D | 0 | 338 | 0 |
| Mode M9 | |||
|---|---|---|---|
| Quadrant | BADHDUFLAG | Total packets | Discarded packets |
| A | 0 | 10 | 0 |
| B | 0 | 10 | 0 |
| C | 0 | 9 | 0 |
| D | 0 | 11 | 0 |
| Mode M0 | |||
|---|---|---|---|
| Quadrant | BADHDUFLAG | Total packets | Discarded packets |
| A | 0 | 38536 | 0 |
| B | 0 | 37078 | 0 |
| C | 0 | 33899 | 0 |
| D | 0 | 37438 | 0 |
| Quadrant | Total seconds | Saturated seconds | Saturation percentage |
|---|---|---|---|
| A | 16389 | 300 | 1.830496% |
| B | 16388 | 349 | 2.129607% |
| C | 16409 | 120 | 0.731306% |
| D | 16425 | 289 | 1.759513% |
Noise dominated data is calculated using 1-second bins in cleaned event files. If a bin has >2000 counts, and if more than 50% of those come from <1% of pixels, then it is considered to be noise-dominated and hence unusable.
| Quadrant | # 1 sec bins | Bins with >0 counts | Bins with >2000 counts | High rate bins dominated by noise | Noise dominated (total time) | Noise dominated (detector-on time) | Marked lightcurve |
|---|---|---|---|---|---|---|---|
| A | 18429 | 17012 | 54 | 54 | 0.29% | 0.32% |  |
| B | 18427 | 17007 | 101 | 101 | 0.55% | 0.59% | 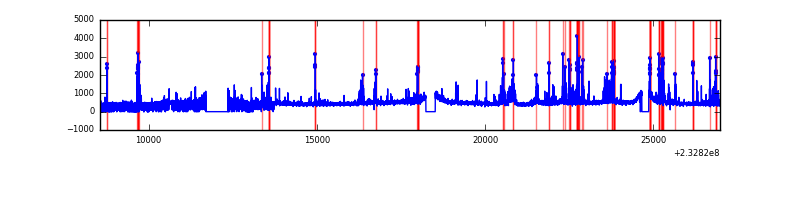 |
| C | 18428 | 16977 | 4 | 4 | 0.02% | 0.02% |  |
| D | 18429 | 16994 | 121 | 121 | 0.66% | 0.71% |  |
Top three noisy pixels from each quadrant. If the there are fewer than three noisy pixels in the level2.evt file, extra rows are filled as -1
| Pixel properties | Quadrant properties | ||||||
|---|---|---|---|---|---|---|---|
| Quadrant | DetID | PixID | Counts | Sigma | Mean | Median | Sigma |
| A | 8 | 5 | 1485767 | 3719.5 | 1956 | 1914 | 398.9 |
| A | 15 | 174 | 109353 | 269.31 | 1956 | 1914 | 398.9 |
| A | 4 | 2 | 52817 | 127.6 | 1956 | 1914 | 398.9 |
| B | 4 | 48 | 581493 | 1530.28 | 1962 | 1914 | 378.7 |
| B | 10 | 16 | 349371 | 917.4 | 1962 | 1914 | 378.7 |
| B | 0 | 214 | 116841 | 303.44 | 1962 | 1914 | 378.7 |
| C | 10 | 22 | 32755 | 69.56 | 1908 | 1917 | 443.3 |
| C | 1 | 3 | 19963 | 40.7 | 1908 | 1917 | 443.3 |
| C | 8 | 128 | 18733 | 37.93 | 1908 | 1917 | 443.3 |
| D | 13 | 105 | 723609 | 1447.2 | 1894 | 1846 | 498.7 |
| D | 8 | 195 | 648749 | 1297.1 | 1894 | 1846 | 498.7 |
| D | 2 | 14 | 128366 | 253.68 | 1894 | 1846 | 498.7 |
Histogram calculated using DETX and DETY for each event in the final _common_clean file
| Quadrant A |  |
 |
Quadrant B |
|---|---|---|---|
| Quadrant D |  |
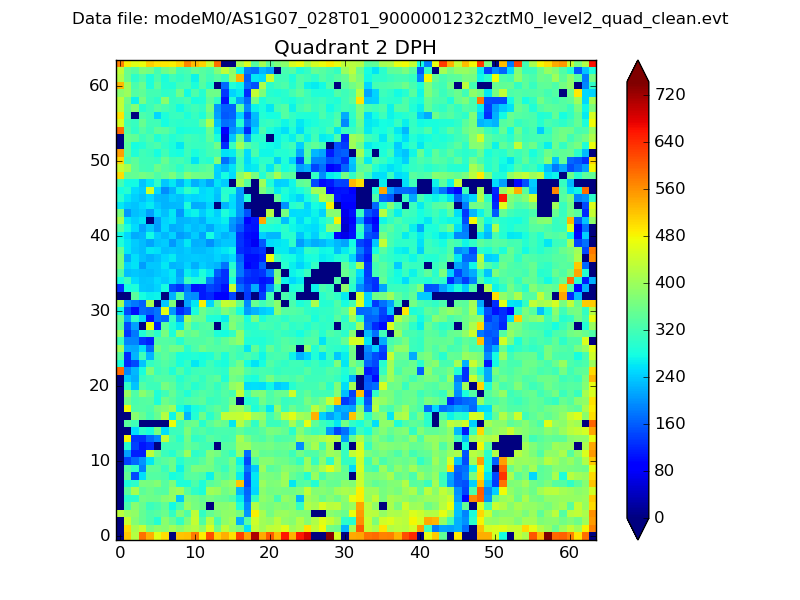 |
Quadrant C |
| Plot type | Count rate plots | Images |
|---|---|---|
| Comparison with Poisson distribution Blue bars denote a histogram of data divided into 1 sec bins. Red curve is a Poisson curve with rate = median count rate of data. |
 |
 |
| Quadrant-wise count rates Data is divided into 100 sec bins |
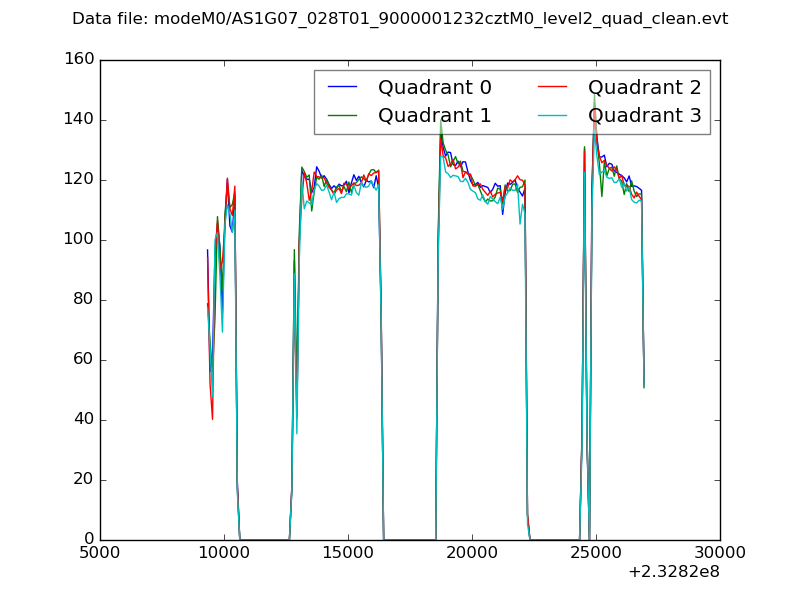 |
|
| Module-wise count rates for Quadrant A Data is divided into 100 sec bins |
 |
 |
| Module-wise count rates for Quadrant B Data is divided into 100 sec bins |
 |
 |
| Module-wise count rates for Quadrant C Data is divided into 100 sec bins |
 |
 |
| Module-wise count rates for Quadrant D Data is divided into 100 sec bins |
 |
 |
| Parameter | Plot |
|---|---|
| CZT HV Monitor | 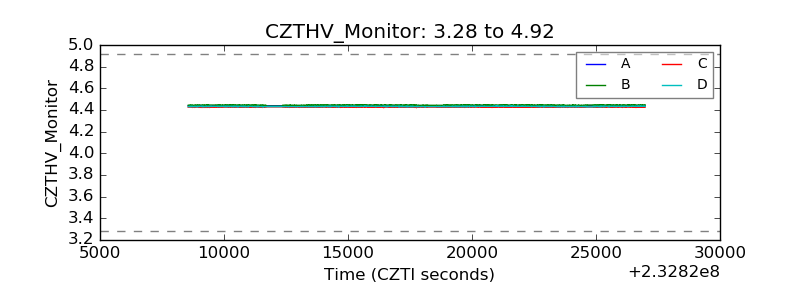 |
| D_VDD |  |
| Temperature 1 |  |
| Veto HV Monitor |  |
| Veto LLD |  |
| Alpha Counter |  |
| _CPM_Rate |  |
| CZT Counter |  |
| +2.5 Volts monitor | 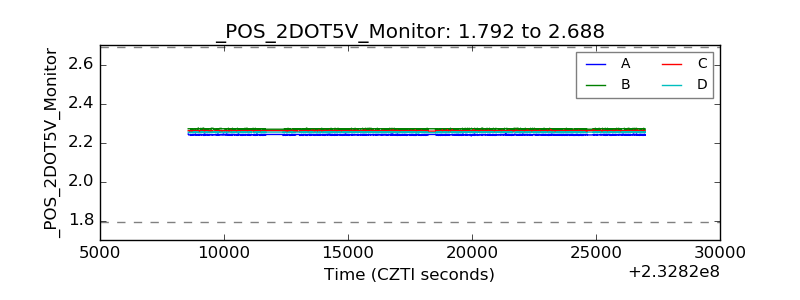 |
| +5 Volts monitor |  |
| _ROLL_ROT |  |
| _Roll_DEC |  |
| _Roll_RA | 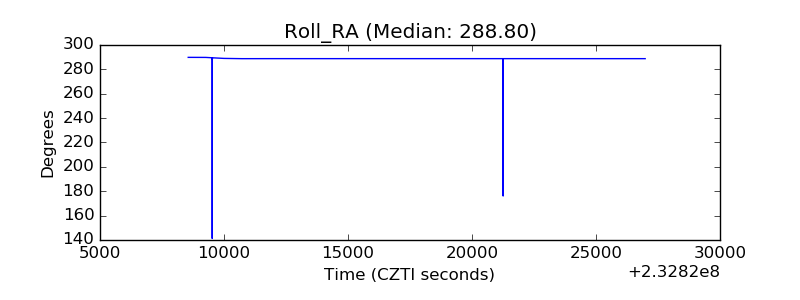 |
| Veto Counter |  |