| Param | Original file | Final file |
|---|---|---|
| Filename | modeM0/AS1A03_036T01_9000001230cztM0_level2.evt | modeM0/AS1A03_036T01_9000001230cztM0_level2_quad_clean.evt |
| Size (bytes) | 414,480,960 | 78,451,200 |
| Size | 395.3 MB | 74.8 MB |
| Events in quadrant A | 2,907,774 | 496,319 |
| Events in quadrant B | 3,056,586 | 496,851 |
| Events in quadrant C | 2,653,618 | 496,856 |
| Events in quadrant D | 3,533,927 | 473,913 |
| Mode M9 | |||
|---|---|---|---|
| Quadrant | BADHDUFLAG | Total packets | Discarded packets |
| A | 0 | 10 | 0 |
| B | 0 | 10 | 0 |
| C | 0 | 10 | 0 |
| D | 0 | 10 | 0 |
| Mode SS | |||
|---|---|---|---|
| Quadrant | BADHDUFLAG | Total packets | Discarded packets |
| A | 0 | 120 | 0 |
| B | 0 | 120 | 0 |
| C | 0 | 120 | 0 |
| D | 0 | 120 | 0 |
| Mode M0 | |||
|---|---|---|---|
| Quadrant | BADHDUFLAG | Total packets | Discarded packets |
| A | 0 | 12652 | 0 |
| B | 0 | 12971 | 0 |
| C | 0 | 12034 | 0 |
| D | 0 | 14135 | 0 |
| Quadrant | Total seconds | Saturated seconds | Saturation percentage |
|---|---|---|---|
| A | 5892 | 54 | 0.916497% |
| B | 5892 | 116 | 1.968771% |
| C | 5892 | 29 | 0.492193% |
| D | 5892 | 93 | 1.578411% |
Noise dominated data is calculated using 1-second bins in cleaned event files. If a bin has >2000 counts, and if more than 50% of those come from <1% of pixels, then it is considered to be noise-dominated and hence unusable.
| Quadrant | # 1 sec bins | Bins with >0 counts | Bins with >2000 counts | High rate bins dominated by noise | Noise dominated (total time) | Noise dominated (detector-on time) | Marked lightcurve |
|---|---|---|---|---|---|---|---|
| A | 6937 | 5893 | 19 | 19 | 0.27% | 0.32% |  |
| B | 6937 | 5893 | 71 | 71 | 1.02% | 1.20% |  |
| C | 6937 | 5892 | 0 | 0 | 0.00% | 0.00% | 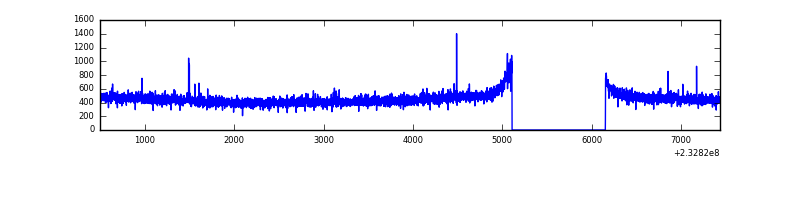 |
| D | 6937 | 5892 | 49 | 49 | 0.71% | 0.83% |  |
Top three noisy pixels from each quadrant. If the there are fewer than three noisy pixels in the level2.evt file, extra rows are filled as -1
| Pixel properties | Quadrant properties | ||||||
|---|---|---|---|---|---|---|---|
| Quadrant | DetID | PixID | Counts | Sigma | Mean | Median | Sigma |
| A | 8 | 5 | 208708 | 1500.7 | 681 | 665 | 138.6 |
| A | 13 | 248 | 36498 | 258.48 | 681 | 665 | 138.6 |
| A | 5 | 16 | 30437 | 214.76 | 681 | 665 | 138.6 |
| B | 5 | 250 | 160738 | 1230.55 | 685 | 668 | 130.1 |
| B | 10 | 16 | 64915 | 493.9 | 685 | 668 | 130.1 |
| B | 0 | 219 | 32543 | 245.04 | 685 | 668 | 130.1 |
| C | 9 | 54 | 8099 | 47.45 | 674 | 677 | 156.4 |
| C | 12 | 4 | 5516 | 30.94 | 674 | 677 | 156.4 |
| C | 13 | 61 | 5132 | 28.48 | 674 | 677 | 156.4 |
| D | 8 | 195 | 488629 | 3020.77 | 668 | 649 | 161.5 |
| D | 10 | 253 | 140545 | 866.01 | 668 | 649 | 161.5 |
| D | 2 | 152 | 133334 | 821.37 | 668 | 649 | 161.5 |
Histogram calculated using DETX and DETY for each event in the final _common_clean file
| Quadrant A | 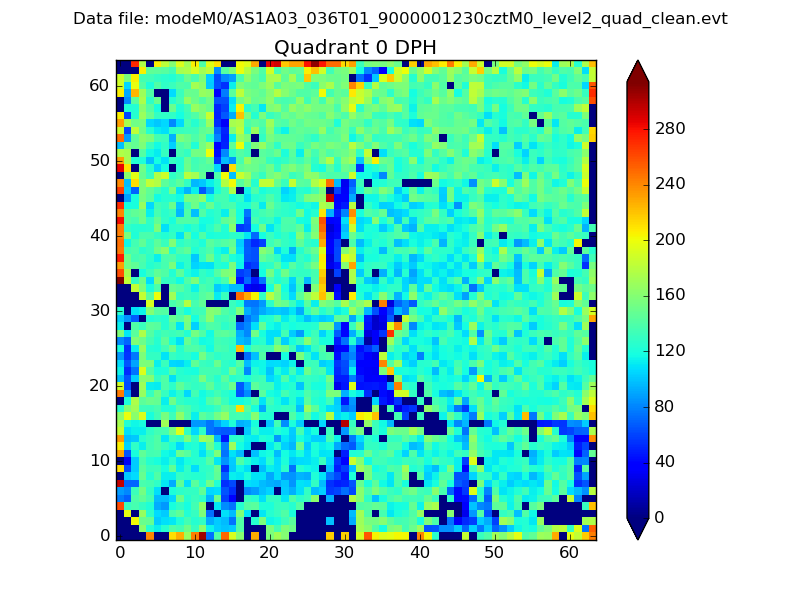 |
 |
Quadrant B |
|---|---|---|---|
| Quadrant D | 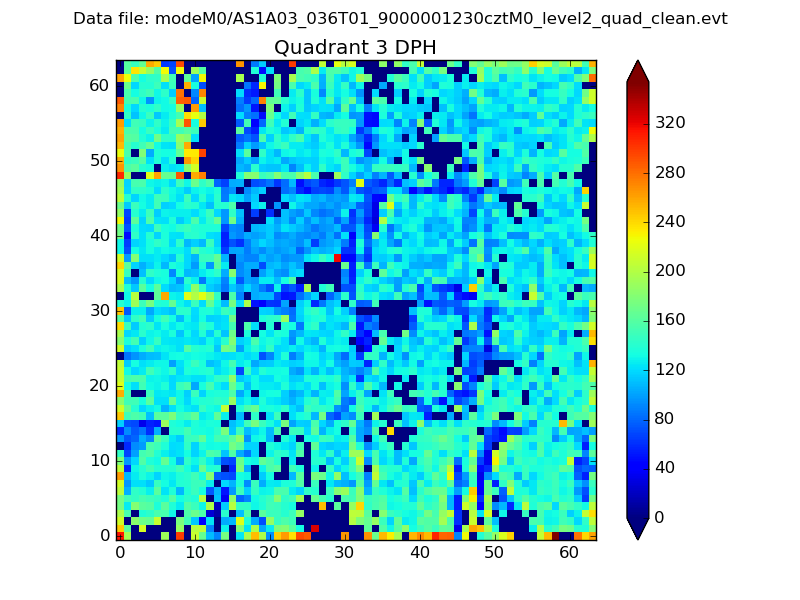 |
 |
Quadrant C |
| Plot type | Count rate plots | Images |
|---|---|---|
| Comparison with Poisson distribution Blue bars denote a histogram of data divided into 1 sec bins. Red curve is a Poisson curve with rate = median count rate of data. |
 |
 |
| Quadrant-wise count rates Data is divided into 100 sec bins |
 |
|
| Module-wise count rates for Quadrant A Data is divided into 100 sec bins |
 |
 |
| Module-wise count rates for Quadrant B Data is divided into 100 sec bins |
 |
 |
| Module-wise count rates for Quadrant C Data is divided into 100 sec bins |
 |
 |
| Module-wise count rates for Quadrant D Data is divided into 100 sec bins |
 |
 |
| Parameter | Plot |
|---|---|
| CZT HV Monitor |  |
| D_VDD | 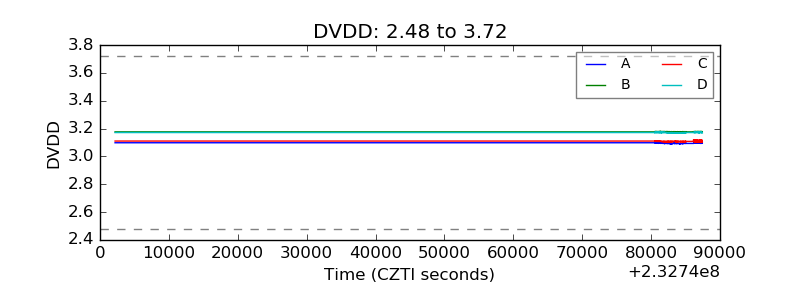 |
| Temperature 1 |  |
| Veto HV Monitor |  |
| Veto LLD | 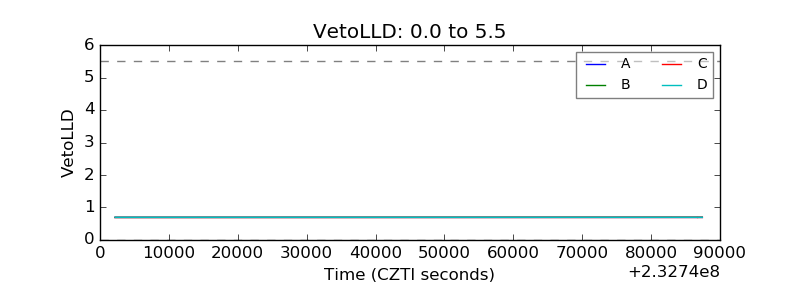 |
| Alpha Counter |  |
| _CPM_Rate |  |
| CZT Counter | 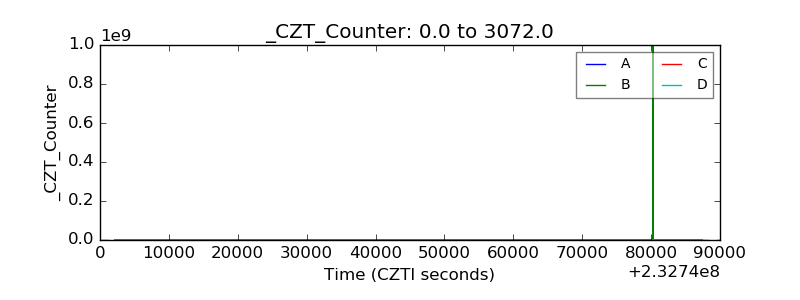 |
| +2.5 Volts monitor |  |
| +5 Volts monitor | 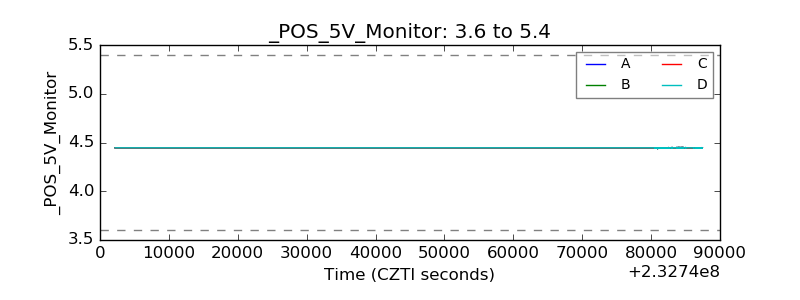 |
| _ROLL_ROT | 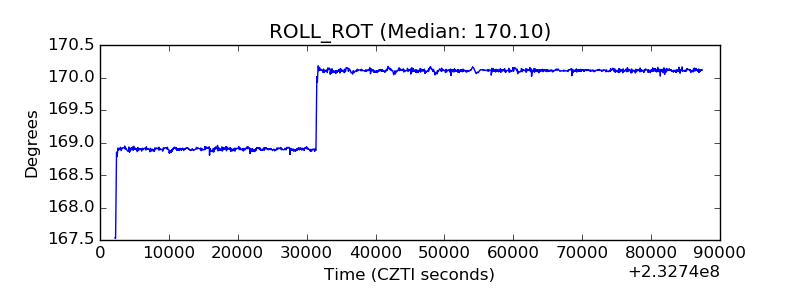 |
| _Roll_DEC |  |
| _Roll_RA |  |
| Veto Counter |  |