| Param | Original file | Final file |
|---|---|---|
| Filename | modeM0/AS1G07_087T01_9000001228cztM0_level2.evt | modeM0/AS1G07_087T01_9000001228cztM0_level2_quad_clean.evt |
| Size (bytes) | 5,784,030,720 | 1,058,258,880 |
| Size | 5.4 GB | 1009.2 MB |
| Events in quadrant A | 44,060,610 | 6,885,805 |
| Events in quadrant B | 38,802,252 | 6,988,909 |
| Events in quadrant C | 33,875,147 | 6,749,421 |
| Events in quadrant D | 53,375,380 | 6,285,677 |
| Mode M9 | |||
|---|---|---|---|
| Quadrant | BADHDUFLAG | Total packets | Discarded packets |
| A | 0 | 138 | 0 |
| B | 0 | 138 | 0 |
| C | 0 | 138 | 0 |
| D | 0 | 138 | 0 |
| Mode M0 | |||
|---|---|---|---|
| Quadrant | BADHDUFLAG | Total packets | Discarded packets |
| A | 0 | 180386 | 0 |
| B | 0 | 165019 | 0 |
| C | 0 | 154249 | 0 |
| D | 0 | 207954 | 0 |
| Mode SS | |||
|---|---|---|---|
| Quadrant | BADHDUFLAG | Total packets | Discarded packets |
| A | 0 | 1538 | 0 |
| B | 0 | 1532 | 0 |
| C | 0 | 1536 | 0 |
| D | 0 | 1536 | 0 |
| Quadrant | Total seconds | Saturated seconds | Saturation percentage |
|---|---|---|---|
| A | 74992 | 1820 | 2.426926% |
| B | 75016 | 1487 | 1.982244% |
| C | 75028 | 585 | 0.779709% |
| D | 75010 | 6099 | 8.130916% |
Noise dominated data is calculated using 1-second bins in cleaned event files. If a bin has >2000 counts, and if more than 50% of those come from <1% of pixels, then it is considered to be noise-dominated and hence unusable.
| Quadrant | # 1 sec bins | Bins with >0 counts | Bins with >2000 counts | High rate bins dominated by noise | Noise dominated (total time) | Noise dominated (detector-on time) | Marked lightcurve |
|---|---|---|---|---|---|---|---|
| A | 99490 | 75130 | 595 | 595 | 0.60% | 0.79% |  |
| B | 99490 | 75160 | 493 | 493 | 0.50% | 0.66% |  |
| C | 99490 | 75161 | 3 | 3 | 0.00% | 0.00% |  |
| D | 99490 | 75161 | 5296 | 5296 | 5.32% | 7.05% |  |
Top three noisy pixels from each quadrant. If the there are fewer than three noisy pixels in the level2.evt file, extra rows are filled as -1
| Pixel properties | Quadrant properties | ||||||
|---|---|---|---|---|---|---|---|
| Quadrant | DetID | PixID | Counts | Sigma | Mean | Median | Sigma |
| A | 8 | 5 | 5529201 | 3088.31 | 8975 | 8800 | 1787.5 |
| A | 15 | 223 | 1846074 | 1027.84 | 8975 | 8800 | 1787.5 |
| A | 15 | 239 | 759175 | 419.79 | 8975 | 8800 | 1787.5 |
| B | 4 | 48 | 2413827 | 1434.93 | 9021 | 8802 | 1676.1 |
| B | 0 | 214 | 511074 | 299.67 | 9021 | 8802 | 1676.1 |
| B | 10 | 16 | 318816 | 184.97 | 9021 | 8802 | 1676.1 |
| C | 13 | 61 | 66525 | 29.21 | 8645 | 8677 | 1980.5 |
| C | 14 | 234 | 60961 | 26.4 | 8645 | 8677 | 1980.5 |
| C | 1 | 16 | 42930 | 17.29 | 8645 | 8677 | 1980.5 |
| D | 2 | 16 | 12793821 | 6213.43 | 8164 | 7964 | 2057.8 |
| D | 1 | 52 | 4027447 | 1953.31 | 8164 | 7964 | 2057.8 |
| D | 8 | 195 | 2052678 | 993.65 | 8164 | 7964 | 2057.8 |
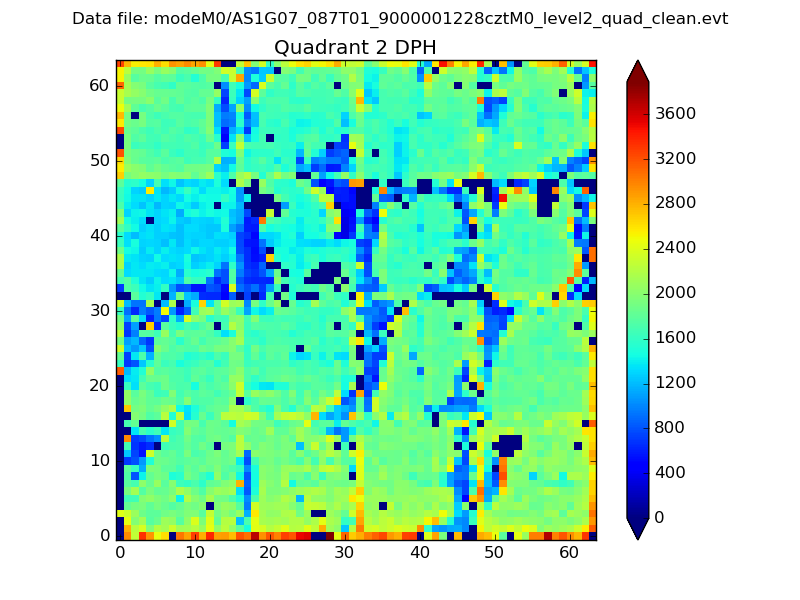
Histogram calculated using DETX and DETY for each event in the final _common_clean file
| Quadrant A |  |
 |
Quadrant B |
|---|---|---|---|
| Quadrant D |  |
 |
Quadrant C |
| Plot type | Count rate plots | Images |
|---|---|---|
| Comparison with Poisson distribution Blue bars denote a histogram of data divided into 1 sec bins. Red curve is a Poisson curve with rate = median count rate of data. |
 |
 |
| Quadrant-wise count rates Data is divided into 100 sec bins |
 |
|
| Module-wise count rates for Quadrant A Data is divided into 100 sec bins |
 |
 |
| Module-wise count rates for Quadrant B Data is divided into 100 sec bins |
 |
 |
| Module-wise count rates for Quadrant C Data is divided into 100 sec bins |
 |
 |
| Module-wise count rates for Quadrant D Data is divided into 100 sec bins |
 |
 |
| Parameter | Plot |
|---|---|
| CZT HV Monitor |  |
| D_VDD |  |
| Temperature 1 |  |
| Veto HV Monitor |  |
| Veto LLD |  |
| Alpha Counter |  |
| _CPM_Rate |  |
| CZT Counter |  |
| +2.5 Volts monitor |  |
| +5 Volts monitor |  |
| _ROLL_ROT |  |
| _Roll_DEC |  |
| _Roll_RA | 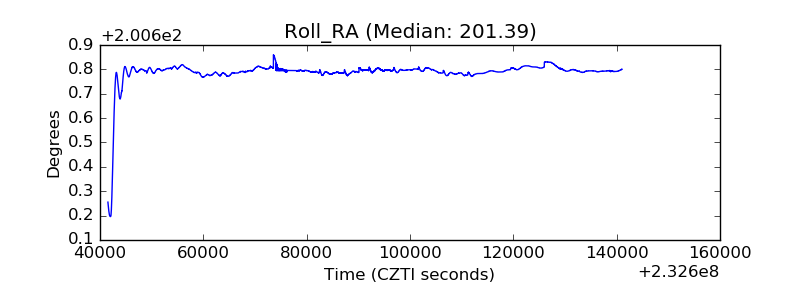 |
| Veto Counter |  |