| Param | Original file | Final file |
|---|---|---|
| Filename | modeM0/AS1A03_135T01_9000001226cztM0_level2.evt | modeM0/AS1A03_135T01_9000001226cztM0_level2_quad_clean.evt |
| Size (bytes) | 526,357,440 | 107,138,880 |
| Size | 502.0 MB | 102.2 MB |
| Events in quadrant A | 4,465,368 | 721,593 |
| Events in quadrant B | 3,208,143 | 727,550 |
| Events in quadrant C | 2,942,259 | 709,781 |
| Events in quadrant D | 4,906,231 | 654,606 |
| Mode M0 | |||
|---|---|---|---|
| Quadrant | BADHDUFLAG | Total packets | Discarded packets |
| A | 0 | 17463 | 0 |
| B | 0 | 13446 | 0 |
| C | 0 | 12841 | 0 |
| D | 0 | 18584 | 0 |
| Mode SS | |||
|---|---|---|---|
| Quadrant | BADHDUFLAG | Total packets | Discarded packets |
| A | 0 | 124 | 0 |
| B | 0 | 124 | 0 |
| C | 0 | 124 | 0 |
| D | 0 | 124 | 0 |
| Mode M9 | |||
|---|---|---|---|
| Quadrant | BADHDUFLAG | Total packets | Discarded packets |
| A | 0 | 13 | 0 |
| B | 0 | 13 | 0 |
| C | 0 | 13 | 0 |
| D | 0 | 13 | 0 |
| Quadrant | Total seconds | Saturated seconds | Saturation percentage |
|---|---|---|---|
| A | 6183 | 266 | 4.302119% |
| B | 6182 | 107 | 1.730831% |
| C | 6183 | 75 | 1.213003% |
| D | 6184 | 573 | 9.265847% |
Noise dominated data is calculated using 1-second bins in cleaned event files. If a bin has >2000 counts, and if more than 50% of those come from <1% of pixels, then it is considered to be noise-dominated and hence unusable.
| Quadrant | # 1 sec bins | Bins with >0 counts | Bins with >2000 counts | High rate bins dominated by noise | Noise dominated (total time) | Noise dominated (detector-on time) | Marked lightcurve |
|---|---|---|---|---|---|---|---|
| A | 7454 | 6184 | 131 | 131 | 1.76% | 2.12% |  |
| B | 7454 | 6184 | 14 | 14 | 0.19% | 0.23% |  |
| C | 7454 | 6184 | 0 | 0 | 0.00% | 0.00% |  |
| D | 7454 | 6184 | 464 | 464 | 6.22% | 7.50% |  |
Top three noisy pixels from each quadrant. If the there are fewer than three noisy pixels in the level2.evt file, extra rows are filled as -1
| Pixel properties | Quadrant properties | ||||||
|---|---|---|---|---|---|---|---|
| Quadrant | DetID | PixID | Counts | Sigma | Mean | Median | Sigma |
| A | 8 | 5 | 1044793 | 6580.49 | 788 | 774 | 158.7 |
| A | 15 | 223 | 239401 | 1504.08 | 788 | 774 | 158.7 |
| A | 15 | 239 | 96882 | 605.77 | 788 | 774 | 158.7 |
| B | 10 | 16 | 141554 | 945.26 | 781 | 764 | 148.9 |
| B | 0 | 214 | 23131 | 150.17 | 781 | 764 | 148.9 |
| B | 12 | 111 | 14901 | 94.92 | 781 | 764 | 148.9 |
| C | 13 | 61 | 5794 | 29.23 | 753 | 758 | 172.3 |
| C | 12 | 4 | 3215 | 14.26 | 753 | 758 | 172.3 |
| C | 3 | 202 | 1966 | 7.01 | 753 | 758 | 172.3 |
| D | 2 | 16 | 1477453 | 7838.55 | 730 | 717 | 188.4 |
| D | 2 | 152 | 393952 | 2087.3 | 730 | 717 | 188.4 |
| D | 1 | 52 | 82866 | 436.05 | 730 | 717 | 188.4 |
Histogram calculated using DETX and DETY for each event in the final _common_clean file
| Quadrant A | 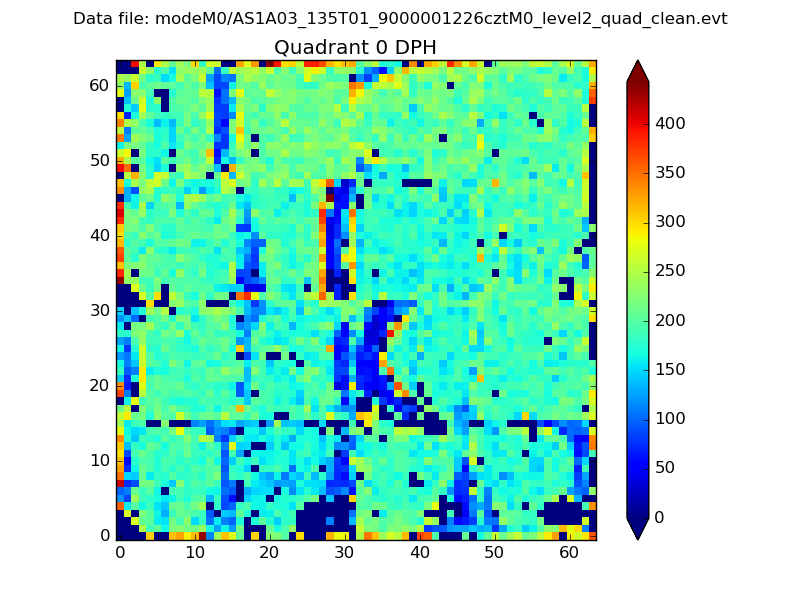 |
 |
Quadrant B |
|---|---|---|---|
| Quadrant D |  |
 |
Quadrant C |
| Plot type | Count rate plots | Images |
|---|---|---|
| Comparison with Poisson distribution Blue bars denote a histogram of data divided into 1 sec bins. Red curve is a Poisson curve with rate = median count rate of data. |
 |
 |
| Quadrant-wise count rates Data is divided into 100 sec bins |
 |
|
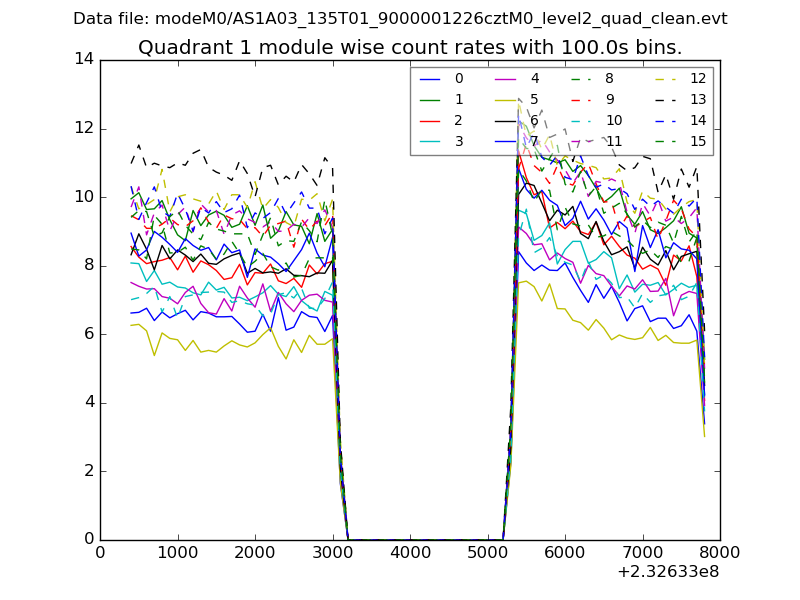
| Module-wise count rates for Quadrant A Data is divided into 100 sec bins |
 |
 |
| Module-wise count rates for Quadrant B Data is divided into 100 sec bins |
 |
 |
| Module-wise count rates for Quadrant C Data is divided into 100 sec bins |
 |
 |
| Module-wise count rates for Quadrant D Data is divided into 100 sec bins |
 |
 |
| Parameter | Plot |
|---|---|
| CZT HV Monitor |  |
| D_VDD |  |
| Temperature 1 |  |
| Veto HV Monitor |  |
| Veto LLD |  |
| Alpha Counter |  |
| _CPM_Rate |  |
| CZT Counter |  |
| +2.5 Volts monitor |  |
| +5 Volts monitor |  |
| _ROLL_ROT |  |
| _Roll_DEC |  |
| _Roll_RA |  |
| Veto Counter | 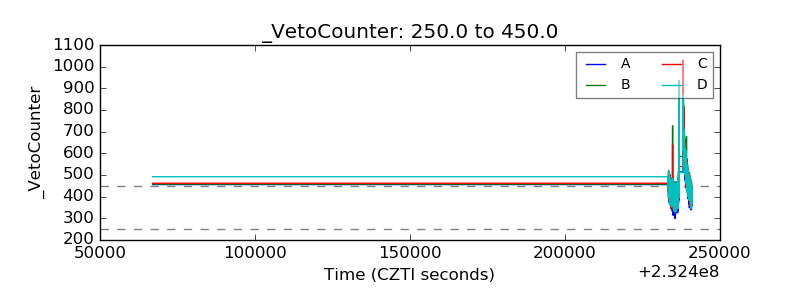 |