| Param | Original file | Final file |
|---|---|---|
| Filename | modeM0/AS1G07_010T03_9000001224cztM0_level2.evt | modeM0/AS1G07_010T03_9000001224cztM0_level2_quad_clean.evt |
| Size (bytes) | 4,760,530,560 | 714,038,400 |
| Size | 4.4 GB | 681.0 MB |
| Events in quadrant A | 31,072,596 | 4,532,960 |
| Events in quadrant B | 27,279,435 | 4,607,447 |
| Events in quadrant C | 26,262,406 | 4,540,469 |
| Events in quadrant D | 55,694,870 | 4,008,471 |
| Mode M9 | |||
|---|---|---|---|
| Quadrant | BADHDUFLAG | Total packets | Discarded packets |
| A | 0 | 69 | 0 |
| B | 0 | 69 | 0 |
| C | 0 | 69 | 0 |
| D | 0 | 69 | 0 |
| Mode M0 | |||
|---|---|---|---|
| Quadrant | BADHDUFLAG | Total packets | Discarded packets |
| A | 0 | 129848 | 0 |
| B | 0 | 119180 | 0 |
| C | 0 | 117698 | 0 |
| D | 0 | 205416 | 0 |
| Mode SS | |||
|---|---|---|---|
| Quadrant | BADHDUFLAG | Total packets | Discarded packets |
| A | 0 | 1170 | 0 |
| B | 0 | 1178 | 0 |
| C | 0 | 1176 | 0 |
| D | 0 | 1170 | 0 |
| Quadrant | Total seconds | Saturated seconds | Saturation percentage |
|---|---|---|---|
| A | 57385 | 1264 | 2.202666% |
| B | 57414 | 614 | 1.069426% |
| C | 57413 | 322 | 0.560849% |
| D | 57170 | 7966 | 13.933881% |
Noise dominated data is calculated using 1-second bins in cleaned event files. If a bin has >2000 counts, and if more than 50% of those come from <1% of pixels, then it is considered to be noise-dominated and hence unusable.
| Quadrant | # 1 sec bins | Bins with >0 counts | Bins with >2000 counts | High rate bins dominated by noise | Noise dominated (total time) | Noise dominated (detector-on time) | Marked lightcurve |
|---|---|---|---|---|---|---|---|
| A | 64743 | 57704 | 602 | 602 | 0.93% | 1.04% |  |
| B | 64743 | 57711 | 22 | 22 | 0.03% | 0.04% |  |
| C | 64743 | 57726 | 15 | 15 | 0.02% | 0.03% |  |
| D | 64742 | 57602 | 6328 | 6328 | 9.77% | 10.99% |  |
Top three noisy pixels from each quadrant. If the there are fewer than three noisy pixels in the level2.evt file, extra rows are filled as -1
| Pixel properties | Quadrant properties | ||||||
|---|---|---|---|---|---|---|---|
| Quadrant | DetID | PixID | Counts | Sigma | Mean | Median | Sigma |
| A | 8 | 5 | 1965557 | 1425.23 | 6815 | 6679 | 1374.4 |
| A | 15 | 223 | 1660977 | 1203.62 | 6815 | 6679 | 1374.4 |
| A | 15 | 239 | 581976 | 418.57 | 6815 | 6679 | 1374.4 |
| B | 4 | 173 | 427404 | 322.48 | 6860 | 6685 | 1304.6 |
| B | 12 | 111 | 149551 | 109.51 | 6860 | 6685 | 1304.6 |
| B | 4 | 80 | 123418 | 89.48 | 6860 | 6685 | 1304.6 |
| C | 14 | 234 | 99552 | 60.09 | 6678 | 6716 | 1545.0 |
| C | 13 | 61 | 50954 | 28.63 | 6678 | 6716 | 1545.0 |
| C | 14 | 67 | 50083 | 28.07 | 6678 | 6716 | 1545.0 |
| D | 2 | 16 | 27615758 | 17579.88 | 6281 | 6126 | 1570.5 |
| D | 2 | 152 | 1422914 | 902.11 | 6281 | 6126 | 1570.5 |
| D | 13 | 122 | 870921 | 550.64 | 6281 | 6126 | 1570.5 |
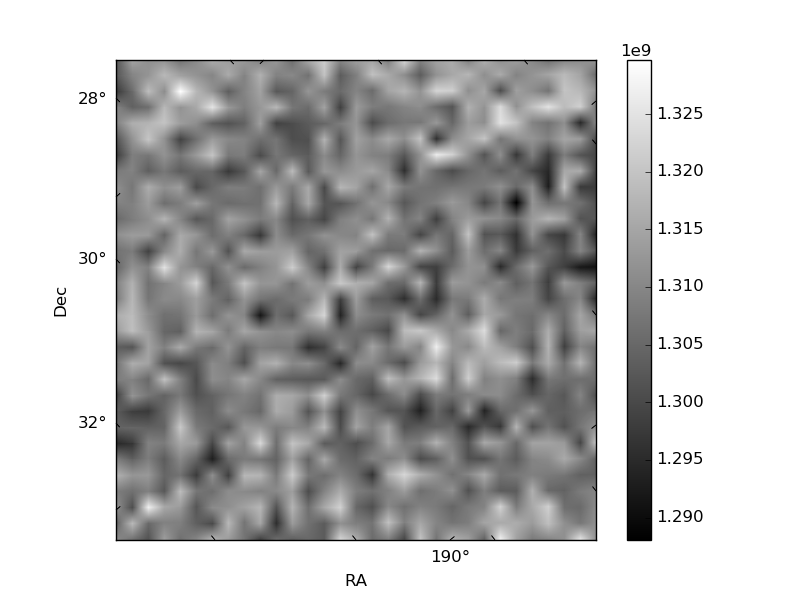
Histogram calculated using DETX and DETY for each event in the final _common_clean file
| Quadrant A |  |
 |
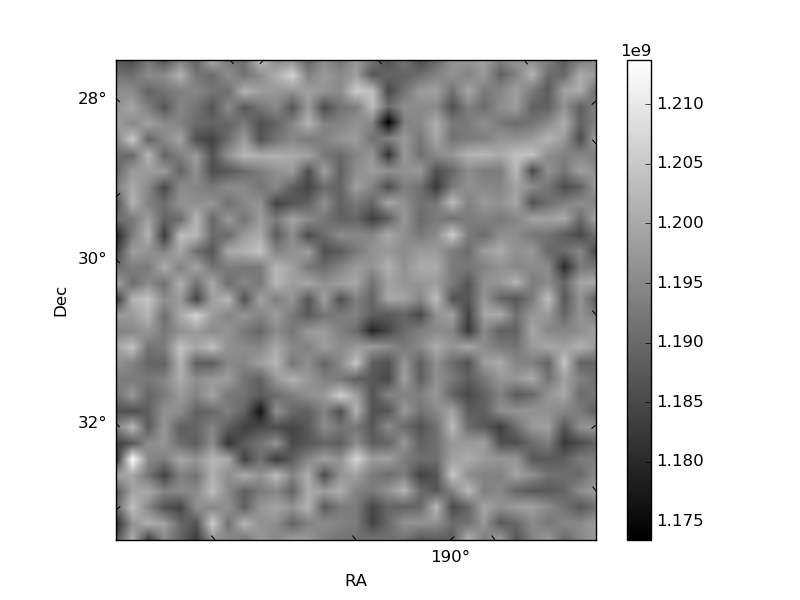
Quadrant B |
|---|---|---|---|
| Quadrant D |  |
 |
Quadrant C |
| Plot type | Count rate plots | Images |
|---|---|---|
| Comparison with Poisson distribution Blue bars denote a histogram of data divided into 1 sec bins. Red curve is a Poisson curve with rate = median count rate of data. |
 |
 |
| Quadrant-wise count rates Data is divided into 100 sec bins |
 |
|
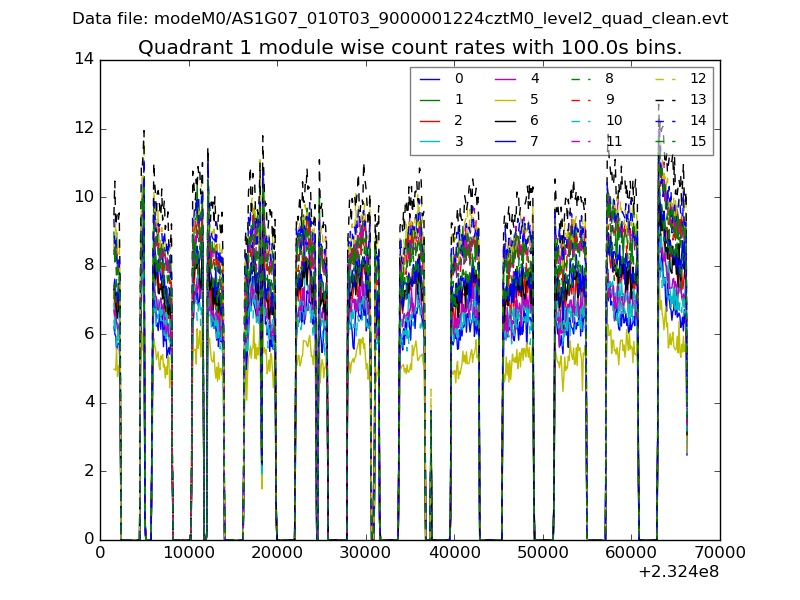
| Module-wise count rates for Quadrant A Data is divided into 100 sec bins |
 |
 |
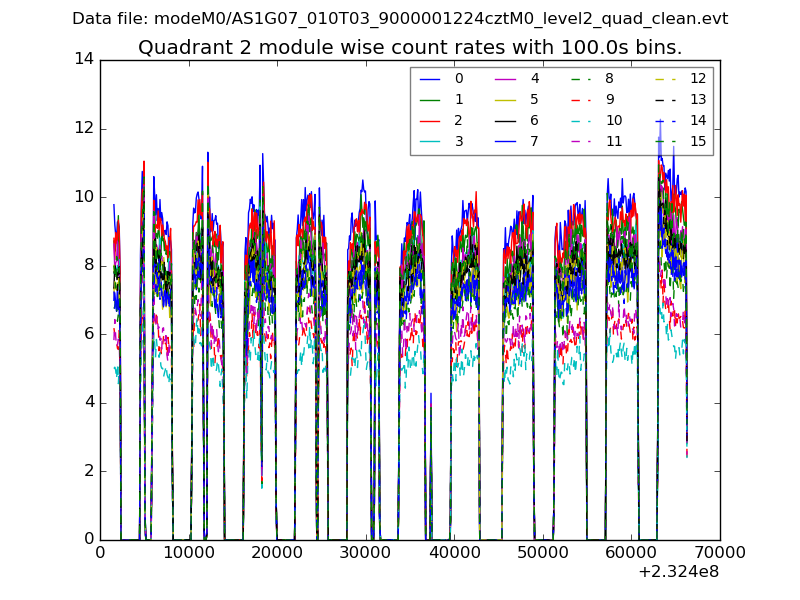
| Module-wise count rates for Quadrant B Data is divided into 100 sec bins |
 |
 |
| Module-wise count rates for Quadrant C Data is divided into 100 sec bins |
 |
 |
| Module-wise count rates for Quadrant D Data is divided into 100 sec bins |
 |
 |
| Parameter | Plot |
|---|---|
| CZT HV Monitor |  |
| D_VDD |  |
| Temperature 1 |  |
| Veto HV Monitor | 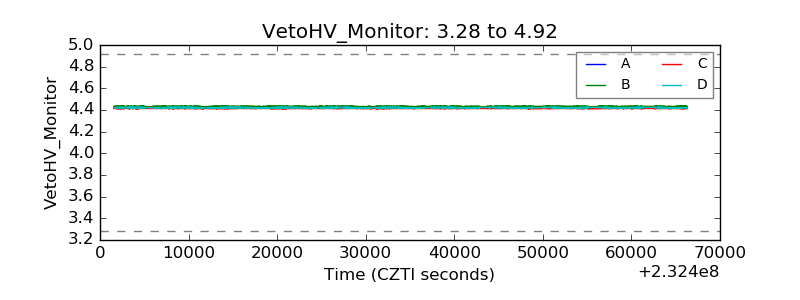 |
| Veto LLD |  |
| Alpha Counter | 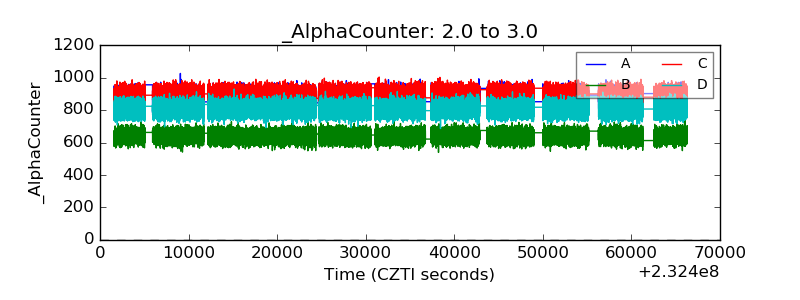 |
| _CPM_Rate |  |
| CZT Counter |  |
| +2.5 Volts monitor |  |
| +5 Volts monitor | 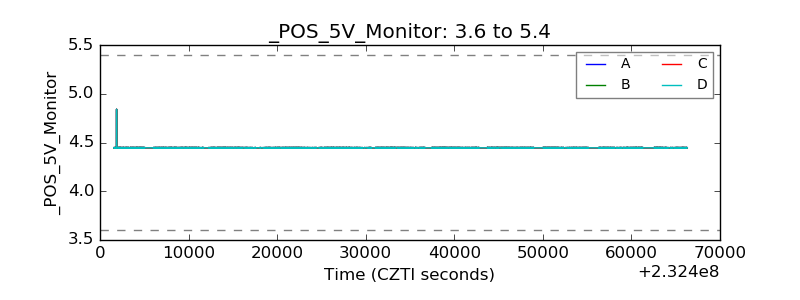 |
| _ROLL_ROT |  |
| _Roll_DEC |  |
| _Roll_RA |  |
| Veto Counter |  |