| Param | Original file | Final file |
|---|---|---|
| Filename | modeM0/AS1A03_038T01_9000001218cztM0_level2.evt | modeM0/AS1A03_038T01_9000001218cztM0_level2_quad_clean.evt |
| Size (bytes) | 6,455,494,080 | 1,163,355,840 |
| Size | 6.0 GB | 1.1 GB |
| Events in quadrant A | 43,272,885 | 7,396,709 |
| Events in quadrant B | 42,330,188 | 7,482,291 |
| Events in quadrant C | 41,480,045 | 7,387,867 |
| Events in quadrant D | 62,396,419 | 6,847,004 |
| Mode SS | |||
|---|---|---|---|
| Quadrant | BADHDUFLAG | Total packets | Discarded packets |
| A | 0 | 1828 | 0 |
| B | 0 | 1824 | 0 |
| C | 0 | 1824 | 0 |
| D | 0 | 1828 | 0 |
| Mode M9 | |||
|---|---|---|---|
| Quadrant | BADHDUFLAG | Total packets | Discarded packets |
| A | 0 | 144 | 0 |
| B | 0 | 144 | 0 |
| C | 0 | 143 | 0 |
| D | 0 | 145 | 0 |
| Mode M0 | |||
|---|---|---|---|
| Quadrant | BADHDUFLAG | Total packets | Discarded packets |
| A | 0 | 187957 | 0 |
| B | 0 | 185628 | 0 |
| C | 0 | 184743 | 0 |
| D | 0 | 247215 | 0 |
| Quadrant | Total seconds | Saturated seconds | Saturation percentage |
|---|---|---|---|
| A | 89341 | 1250 | 1.399134% |
| B | 89360 | 1278 | 1.430170% |
| C | 89362 | 843 | 0.943354% |
| D | 89120 | 6878 | 7.717684% |
Noise dominated data is calculated using 1-second bins in cleaned event files. If a bin has >2000 counts, and if more than 50% of those come from <1% of pixels, then it is considered to be noise-dominated and hence unusable.
| Quadrant | # 1 sec bins | Bins with >0 counts | Bins with >2000 counts | High rate bins dominated by noise | Noise dominated (total time) | Noise dominated (detector-on time) | Marked lightcurve |
|---|---|---|---|---|---|---|---|
| A | 104358 | 89786 | 94 | 94 | 0.09% | 0.10% |  |
| B | 104358 | 89814 | 62 | 62 | 0.06% | 0.07% |  |
| C | 104358 | 89821 | 41 | 41 | 0.04% | 0.05% |  |
| D | 104357 | 89576 | 5726 | 5726 | 5.49% | 6.39% |  |
Top three noisy pixels from each quadrant. If the there are fewer than three noisy pixels in the level2.evt file, extra rows are filled as -1
| Pixel properties | Quadrant properties | ||||||
|---|---|---|---|---|---|---|---|
| Quadrant | DetID | PixID | Counts | Sigma | Mean | Median | Sigma |
| A | 13 | 251 | 952336 | 436.37 | 10738 | 10515 | 2158.3 |
| A | 5 | 16 | 364933 | 164.21 | 10738 | 10515 | 2158.3 |
| A | 8 | 5 | 325277 | 145.84 | 10738 | 10515 | 2158.3 |
| B | 10 | 16 | 421789 | 201.52 | 10759 | 10503 | 2040.9 |
| B | 12 | 111 | 229529 | 107.32 | 10759 | 10503 | 2040.9 |
| B | 11 | 111 | 186153 | 86.06 | 10759 | 10503 | 2040.9 |
| C | 9 | 54 | 199799 | 78.09 | 10494 | 10555 | 2423.5 |
| C | 9 | 68 | 111910 | 41.82 | 10494 | 10555 | 2423.5 |
| C | 13 | 61 | 78690 | 28.11 | 10494 | 10555 | 2423.5 |
| D | 2 | 16 | 14682105 | 5838.29 | 10079 | 9821 | 2513.1 |
| D | 2 | 152 | 4055165 | 1609.69 | 10079 | 9821 | 2513.1 |
| D | 1 | 52 | 3140758 | 1245.84 | 10079 | 9821 | 2513.1 |
Histogram calculated using DETX and DETY for each event in the final _common_clean file
| Quadrant A |  |
 |
Quadrant B |
|---|---|---|---|
| Quadrant D |  |
 |
Quadrant C |
| Plot type | Count rate plots | Images |
|---|---|---|
| Comparison with Poisson distribution Blue bars denote a histogram of data divided into 1 sec bins. Red curve is a Poisson curve with rate = median count rate of data. |
 |
 |
| Quadrant-wise count rates Data is divided into 100 sec bins |
 |
|
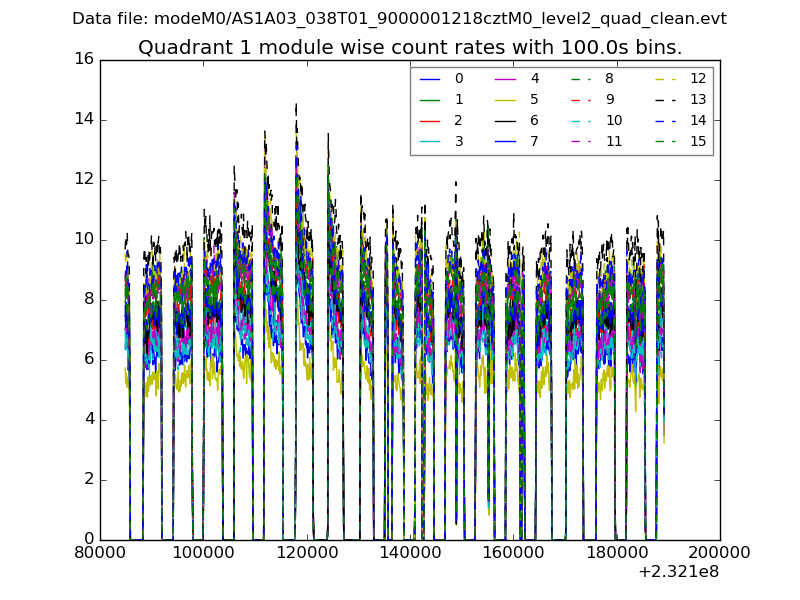
| Module-wise count rates for Quadrant A Data is divided into 100 sec bins |
 |
 |
| Module-wise count rates for Quadrant B Data is divided into 100 sec bins |
 |
 |
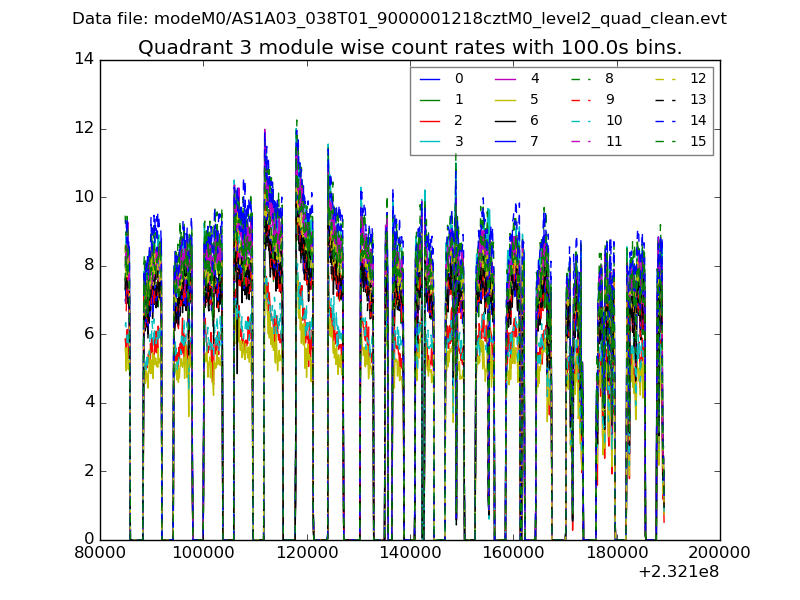
| Module-wise count rates for Quadrant C Data is divided into 100 sec bins |
 |
 |
| Module-wise count rates for Quadrant D Data is divided into 100 sec bins |
 |
 |
| Parameter | Plot |
|---|---|
| CZT HV Monitor |  |
| D_VDD |  |
| Temperature 1 |  |
| Veto HV Monitor |  |
| Veto LLD |  |
| Alpha Counter |  |
| _CPM_Rate |  |
| CZT Counter |  |
| +2.5 Volts monitor |  |
| +5 Volts monitor |  |
| _ROLL_ROT |  |
| _Roll_DEC |  |
| _Roll_RA |  |
| Veto Counter |  |