| Param | Original file | Final file |
|---|---|---|
| Filename | modeM0/AS1A02_132T01_9000001212cztM0_level2.evt | modeM0/AS1A02_132T01_9000001212cztM0_level2_quad_clean.evt |
| Size (bytes) | 5,808,528,000 | 1,120,743,360 |
| Size | 5.4 GB | 1.0 GB |
| Events in quadrant A | 40,942,379 | 7,012,717 |
| Events in quadrant B | 40,682,157 | 7,243,253 |
| Events in quadrant C | 39,439,877 | 7,188,685 |
| Events in quadrant D | 49,190,350 | 6,755,591 |
| Mode SS | |||
|---|---|---|---|
| Quadrant | BADHDUFLAG | Total packets | Discarded packets |
| A | 0 | 1700 | 0 |
| B | 0 | 1696 | 0 |
| C | 0 | 1700 | 0 |
| D | 0 | 1702 | 0 |
| Mode M0 | |||
|---|---|---|---|
| Quadrant | BADHDUFLAG | Total packets | Discarded packets |
| A | 0 | 177330 | 0 |
| B | 0 | 176158 | 0 |
| C | 0 | 173727 | 0 |
| D | 0 | 203730 | 0 |
| Mode M9 | |||
|---|---|---|---|
| Quadrant | BADHDUFLAG | Total packets | Discarded packets |
| A | 0 | 142 | 0 |
| B | 0 | 143 | 0 |
| C | 0 | 143 | 0 |
| D | 0 | 143 | 0 |
| Quadrant | Total seconds | Saturated seconds | Saturation percentage |
|---|---|---|---|
| A | 83833 | 1355 | 1.616309% |
| B | 83861 | 1276 | 1.521565% |
| C | 83858 | 807 | 0.962341% |
| D | 83796 | 3738 | 4.460833% |
Noise dominated data is calculated using 1-second bins in cleaned event files. If a bin has >2000 counts, and if more than 50% of those come from <1% of pixels, then it is considered to be noise-dominated and hence unusable.
| Quadrant | # 1 sec bins | Bins with >0 counts | Bins with >2000 counts | High rate bins dominated by noise | Noise dominated (total time) | Noise dominated (detector-on time) | Marked lightcurve |
|---|---|---|---|---|---|---|---|
| A | 98777 | 84256 | 163 | 163 | 0.17% | 0.19% | 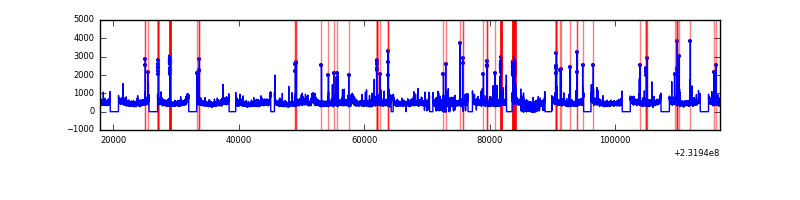 |
| B | 98777 | 84246 | 28 | 28 | 0.03% | 0.03% |  |
| C | 98777 | 84262 | 42 | 42 | 0.04% | 0.05% |  |
| D | 98777 | 84231 | 2753 | 2753 | 2.79% | 3.27% |  |
Top three noisy pixels from each quadrant. If the there are fewer than three noisy pixels in the level2.evt file, extra rows are filled as -1
| Pixel properties | Quadrant properties | ||||||
|---|---|---|---|---|---|---|---|
| Quadrant | DetID | PixID | Counts | Sigma | Mean | Median | Sigma |
| A | 13 | 251 | 1534398 | 748.44 | 10135 | 9925 | 2036.9 |
| A | 15 | 174 | 213944 | 100.16 | 10135 | 9925 | 2036.9 |
| A | 5 | 16 | 201468 | 94.04 | 10135 | 9925 | 2036.9 |
| B | 5 | 255 | 396363 | 199.74 | 10260 | 10025 | 1934.2 |
| B | 12 | 111 | 209926 | 103.35 | 10260 | 10025 | 1934.2 |
| B | 11 | 111 | 170255 | 82.84 | 10260 | 10025 | 1934.2 |
| C | 14 | 234 | 289247 | 120.96 | 10018 | 10073 | 2307.9 |
| C | 13 | 61 | 75016 | 28.14 | 10018 | 10073 | 2307.9 |
| C | 12 | 4 | 45923 | 15.53 | 10018 | 10073 | 2307.9 |
| D | 1 | 52 | 9732553 | 4167.47 | 9768 | 9554 | 2333.1 |
| D | 7 | 71 | 626272 | 264.34 | 9768 | 9554 | 2333.1 |
| D | 2 | 14 | 578720 | 243.96 | 9768 | 9554 | 2333.1 |
Histogram calculated using DETX and DETY for each event in the final _common_clean file
| Quadrant A |  |
 |
Quadrant B |
|---|---|---|---|
| Quadrant D |  |
 |
Quadrant C |
| Plot type | Count rate plots | Images |
|---|---|---|
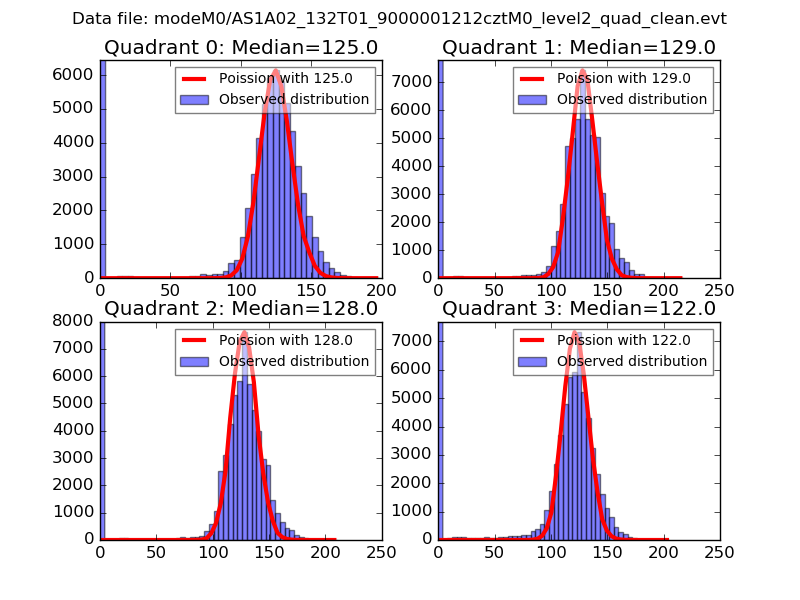
| Comparison with Poisson distribution Blue bars denote a histogram of data divided into 1 sec bins. Red curve is a Poisson curve with rate = median count rate of data. |
 |
 |
| Quadrant-wise count rates Data is divided into 100 sec bins |
 |
|
| Module-wise count rates for Quadrant A Data is divided into 100 sec bins |
 |
 |
| Module-wise count rates for Quadrant B Data is divided into 100 sec bins |
 |
 |
| Module-wise count rates for Quadrant C Data is divided into 100 sec bins |
 |
 |
| Module-wise count rates for Quadrant D Data is divided into 100 sec bins |
 |
 |
| Parameter | Plot |
|---|---|
| CZT HV Monitor |  |
| D_VDD |  |
| Temperature 1 |  |
| Veto HV Monitor | 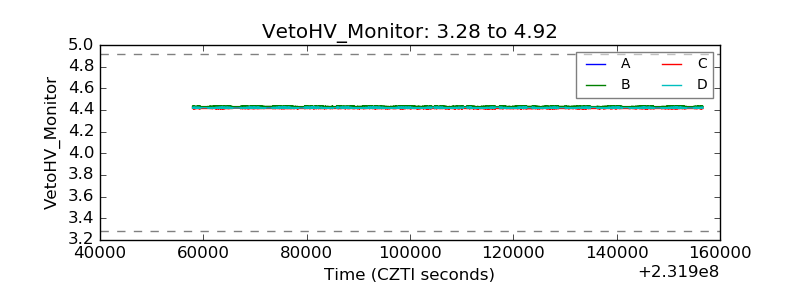 |
| Veto LLD |  |
| Alpha Counter | 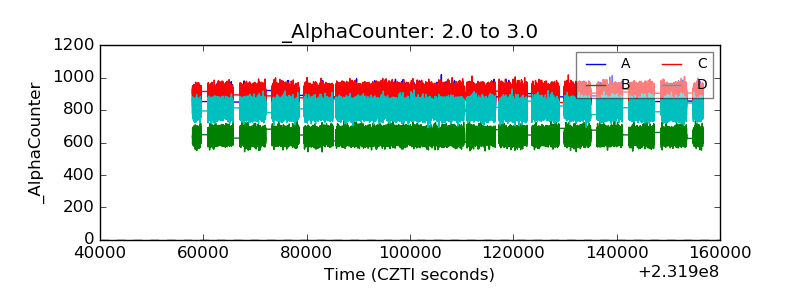 |
| _CPM_Rate |  |
| CZT Counter |  |
| +2.5 Volts monitor | 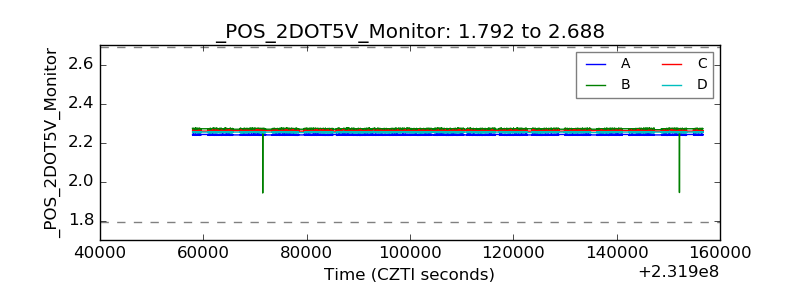 |
| +5 Volts monitor |  |
| _ROLL_ROT |  |
| _Roll_DEC |  |
| _Roll_RA | 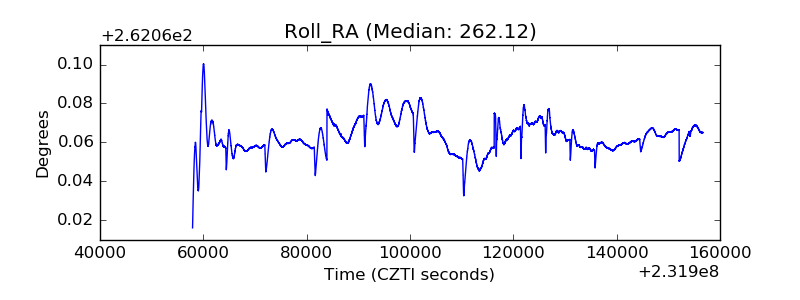 |
| Veto Counter |  |